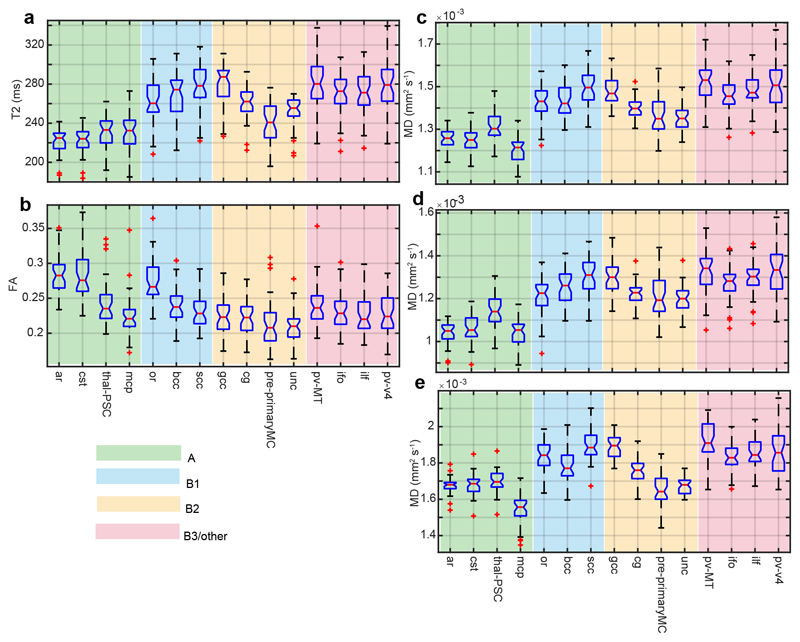
Figure 1.
Boxplots of TBSS-derived medians for DTI scalars and T2 across the whole cohort.
The graphs are sorted by descending FA within each myelogenesis group (indicated by color) are as follows: A = myelination detectable at term age; B1 = no myelination detectable at term age, fast rate of myelination after birth; B2 = no myelination detectable at term age, intermediate rate of myelination after birth; B3/other = no myelination detectable at term age, slow rate of myelination after birth. Abbreviations used: FA = fractional anisotropy; MD = mead diffusivity. See Table 2 for white matter tract abbreviations.

