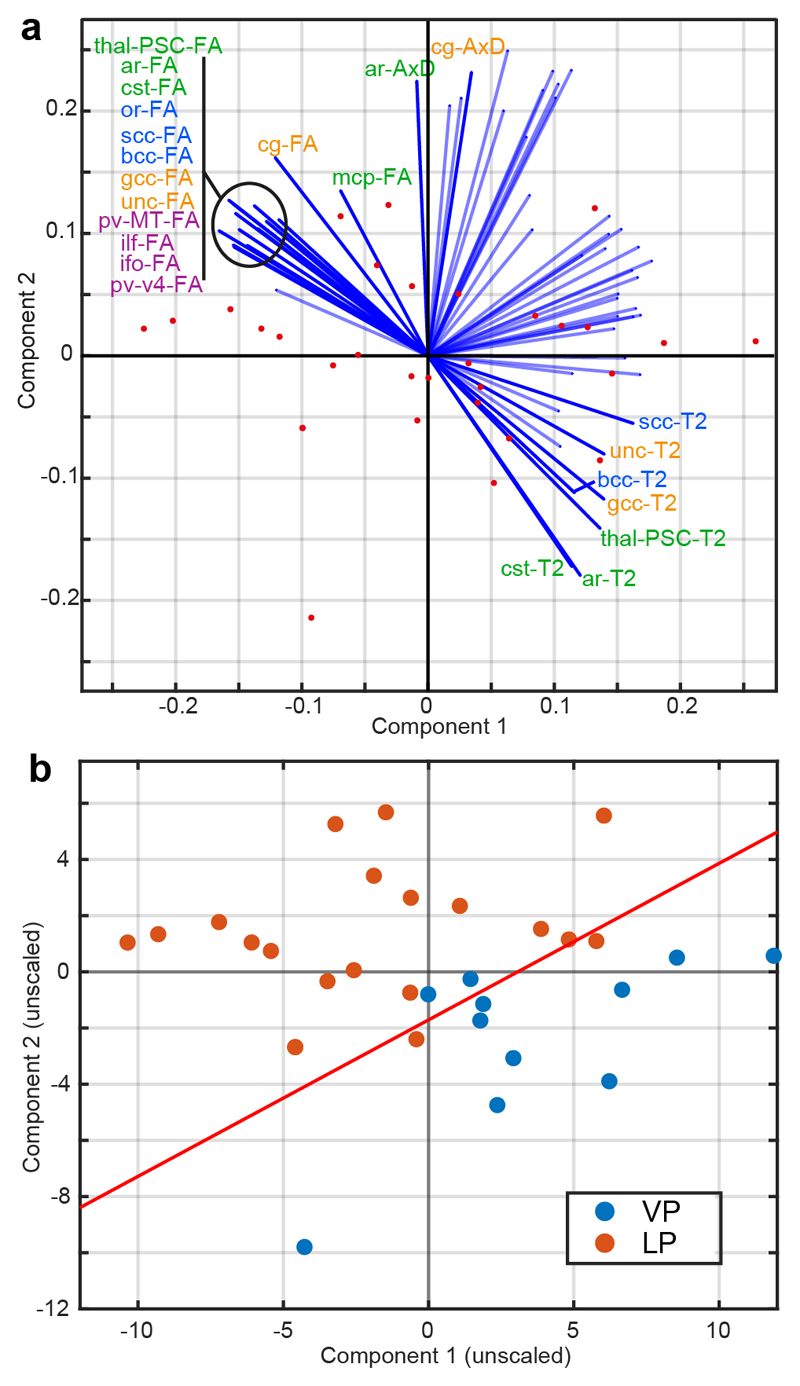
Figure 4.
PCA and LDA of tract-wise median DTI scalars and T2 in the TBSS-positive ROI. Panel a shows PCA, reduced to 2 dimensions, with the original variables labelled as projections. The projections are labelled (and in solid color) if their projection normal to the LDA hyperplane is > 0.15, which implies that more than 15% of the variance in that variable is accounted for by group. Text labels are colored by myelogenesis group. Panel b shows the PCA with data points labelled by group, as well as the LDA hyperplane as a solid line. Abbreviations used: PCA = principal component analysis; LDA = linear discriminant analysis; VP = very preterm; LP = late preterm. See Table 2 for WM tract abbreviations.

