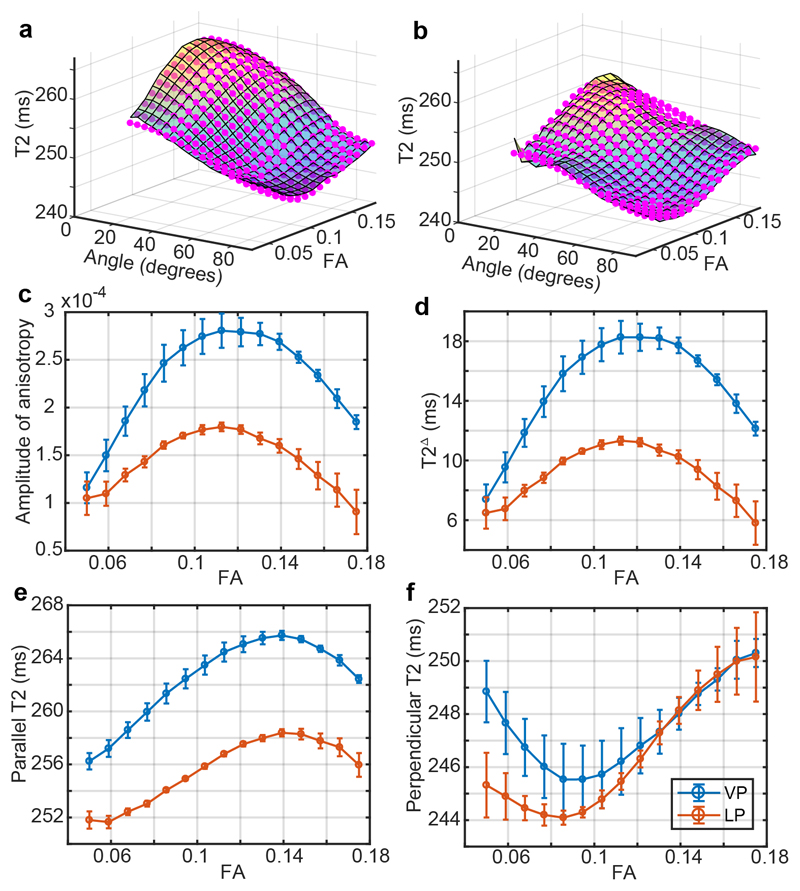
Figure 5.
T2 anisotropy in the term-equivalent infant brain. Panels a and b show surfaces of T2 against FA and the fibre-to-field angle obtained from DTI, with each plotted value of the opaque surface being the average value in the corresponding 2D bin range. Magenta points are the fit of Eq. 1. The VP and LP groups are plotted in a and b respectively. Panels c-f show, respectively, the fitted values at each FA bin range of the amplitude of anisotropy A, T2Δ, T2|| and T2per. Abbreviations used: VP = very preterm; LP = late preterm; FA = fractional anisotropy.

