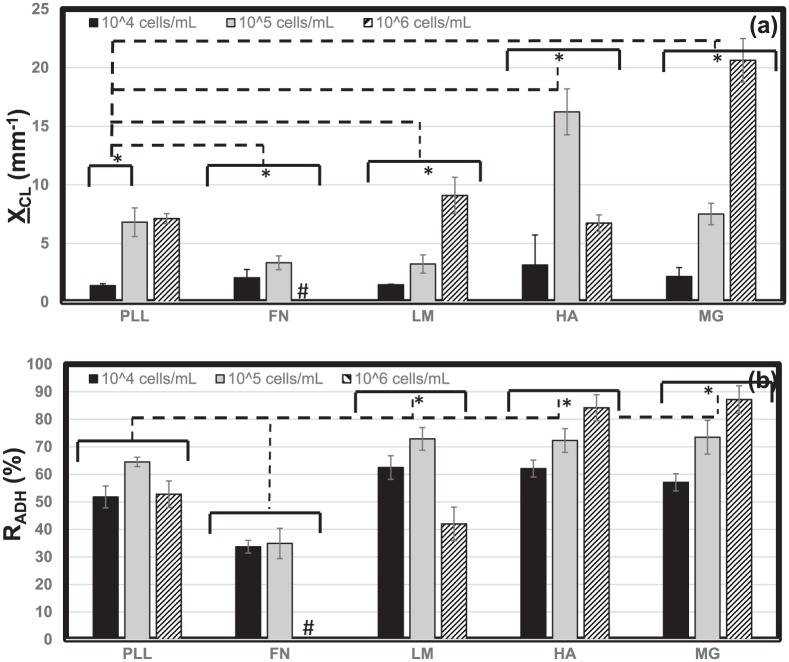
Figure 6.
Metrics of adhered neuroclusters. The projected surface area of adhered retinal neuroclusters was measured to determine (a) mean cluster size, XCL, upon poly-l-lysine (PLL), fibronectin (FN), laminin (LM), hyaluronic acid (HA), and Matrigel (MG) at cell densities of 104, 105, and106 cells/mL. (b) The percentage of adhered cell areas occupied by neuroclusters as measured by the adhesion ratio, RADH. Statistical significance across and between bracketed values is denoted by an asterisk. The “#” symbol indicates a cell monolayer on FN.

