

Abstract
Ultrasound molecular imaging (USMI) is accomplished by detecting microbubble (MB) contrast agents that have bound to specific biomarkers, and can be used for a variety of imaging applications, such as the early detection of cancer. USMI has been widely utilized in preclinical imaging in mice; however, USMI in humans can be challenging because of the low concentration of bound MBs and the signal degradation caused by the presence of heterogenous soft tissue between the transducer and the lesion. Short-lag spatial coherence (SLSC) beamforming has been proposed as a robust technique that is less affected by poor signal quality than standard delay-and-sum (DAS) beamforming. In this study, USMI performance was assessed using contrast-enhanced ultrasound imaging combined with DAS (conventional CEUS) and with SLSC (SLSC-CEUS). Each method was characterized in flow channel phantom experiments. In a USMI-mimicking phantom, SLSC-CEUS was found to be more robust to high levels of additive thermal noise than DAS, with a 6dB SNR improvement when the thermal noise level was +6 dB or higher. However, SLSC-CEUS was also found to be insensitive to increases in MB concentration, making it a poor choice for perfusion imaging. USMI performance was also measured in vivo using VEGFR2-targeted MBs in mice with subcutaneous human hepatocellular carcinoma tumors, with clinical imaging conditions mimicked using a porcine tissue layer between the tumor and the transducer. SLSC-CEUS improved the SNR in each of 10 tumors by an average of 41%, corresponding to 3.0 dB SNR. These results indicate that the SLSC beamformer is well-suited for USMI applications because of its high sensitivity and robust properties under challenging imaging conditions.
Keywords: Index Terms, Ultrasound, Molecular and cellular imaging, Image enhancement/restoration (noise and artifact reduction)
I. Introduction
IN contrast-enhanced ultrasonography (CEUS), microbubble (MB) contrast agents have been used to enhance anatomical and functional imaging [1]. In particular, MB contrast agents have improved images of the heart [2], [3], focal liver lesions [4], [5], kidney [6], and breast tumor vasculature [7], among numerous other applications [8]–[10]. Despite ranging from only 1 to 4 micrometers in diameter, MB contrast agents have a strong scattering response to insonification, making them easily detectable with ultrasound [10]–[12].
In addition to enhancing contrast, MBs have enabled ultrasound molecular imaging (USMI). Molecular imaging, in general, is an extension of diagnostic imaging modalities whereby “molecular probes” are used to attach to specific molecules or biomarkers or are designed to be taken up by a cellular process. These molecular probes are often designed so that they are highly visible with the imaging system, and thereby give clinicians the capability to detect targets that express these specific molecules, biomarkers, or cellular processes. USMI can be achieved by coating MB surfaces with ligands and antibodies to target the specific biomarkers. For example, MBs can be targeted with high specificity to vascular endothelial growth factor receptor 2 (VEGFR2), an antigen over-expressed in growing tumors [13], [14]. By combining the high specificity of molecular targeting with the high sensitivity of ultrasound, USMI has been successfully implemented in several preclinical applications [14]–[24]. More recently, USMI has been clinically translated in patients in a clinical study of breast and ovarian cancer [25]. These applications demonstrate the great potential for USMI in the early detection of cancer.
The ability to detect MBs with high sensitivity and to discern them from the background with high specificity is critical to USMI, especially as research transitions into the clinic. Clinical imaging is beset by additional challenges that are often not observed in preclinical studies. For instance, preclinical tumors are often more accessible than clinical tumors, which are usually embedded beneath several centimeters of tissue. Heterogeneous tissue leads to image degradation via attenuation, phase aberration, and reverberation clutter [26]. Clinical imaging frequencies also tend to be lower than the ones used in small animal imaging, resulting in lower resolution. These challenges are compounded by the inherently low signal-to-noise ratio (SNR) resulting from the specialized pulses that are used to keep the microbubbles intact. In a recent clinical USMI study, a “strong” signal-to-background ratio (SBR) in malignant breast lesions was reported to be 2.13, whereas a “weak” SBR was 1.34 [25], corresponding to decibel-scale SNRs of 6.6 dB and 2.5 dB, respectively.
Many pulse-sequencing techniques have been developed to improve the sensitivity of CEUS. In non-destructive CEUS, specially-designed low-pressure pulses are used to resonate MBs without destroying them. The weak pulses typically have a mechanical index (MI) between 0.1 and 0.3, far below the pressures typically used in diagnostic imaging [27], [28]. At these pressures, the MBs generate a stronger harmonic response than tissue, allowing the two to be easily differentiated [11]. MB signals have been isolated using the second harmonic frequency [29], the subharmonic [30], or a broadband response as in acoustic angiography [31] and broadband imaging [32].
Other novel pulsing methods have been developed to reduce MI and to improve MB adhesion. Synthetic transmit focusing techniques, in which multiple unfocused transmissions are focused retrospectively, have been employed to avoid forming a physical focus that could destroy MBs at the cost of sensitivity to motion artifacts [33], [34]. This method, popularized as “ultrafast” imaging, has the additional benefit of insonifying the entire medium, enabling image reconstruction of the entire field with fewer pulse-echo acquisitions and improving frame rates. Acoustic radiation force (ARF) has also been used in molecular imaging applications to enhance MB binding by pushing the MBs towards receptors on vessel walls [35], [36].
Image-analysis techniques have also been developed to enhance MB visibility. A common method to remove tissue signals is to acquire CEUS images both before and after a strong destructive pulse, and to subtract the latter image from the former [37]. A method referred to as dwell-time imaging has been shown to give accurate and reproducible quasi real-time quantification of expression levels of molecules on the tumor vasculature [38].
Each of the techniques described above are used in conjunction with the classical delay-and-sum (DAS) beamformer. The DAS beamformer is vulnerable to well-known artifacts such as speckle [39], clutter [40], and phase aberration [41]. DAS treats the entire transducer array as a single steerable element and forms images based on the magnitude of the average signal received by the array. However, the backscattered wave contains useful information beyond the magnitude, particularly in its spatial structure. In this paper, we propose to improve MB detection in the aperture domain using an alternative coherence beamforming technique.
Short-lag spatial coherence (SLSC) is a beamforming technique in which images are formed using the spatial coherence of the echo, rather than its magnitude [42]. The spatial coherence is a measure of the similarity of two points along a wavefront as a function of their spacing. SLSC is a promising approach for molecular CEUS imaging because signals from point sources such as MBs have higher spatial coherence than signals from diffuse scatterers (e.g., tissue) and from incoherent noise (e.g., reverberation clutter) [42]–[45]. SLSC has been shown to be more robust to noisy imaging conditions than DAS in simulations and in vivo [46], [47], and when used together with harmonic imaging [48], [49].
In this paper, the DAS and SLSC beamformers are compared in a molecular CEUS study under conditions that mimic the challenges associated with clinical imaging. The techniques are applied in flow channel phantoms as well as in an in vivo experiment in a mouse model of hepatocellular carcinoma.
II. Beamforming
A. Conventional DAS Beamforming
Denote the complex signals received on a 1D uniform linear array of N elements as , where the signals are focused at a field point using appropriate focusing time delays. In the case of multi-pulse harmonic imaging, it is assumed that the pulses have already been combined. A conventional CEUS image pixel is computed using the DAS beamformer:
| (1) |
That is, the pixel value is the magnitude of the sum of the signals. The resulting image is often logarithmically compressed to improve visualization.
B. SLSC Beamforming
The SLSC beamformer consists of two steps: estimating the spatial coherence function, and integrating the coherence function at short lags [42]. The spatial coherence function is measured as the correlation coefficient between signals with a spacing (also referred to as a “lag”) of m elements. On a 1D array, this is computed as the sample correlation coefficient of all signal pairs at lag m:
| (2) |
where is the covariance of signals si and si+m:
| (3) |
Here, the symbol * denotes the complex conjugate, and the covariance is computed over some kernel , typically selected to be an axial signal window with an extent of one wavelength [42], although a kernel-less approach [50] using a single sample for the estimation can be utilized for fast computation without loss in axial resolution:
| (4) |
Some representative examples of spatial coherence functions are presented in Fig. 1, as measured in in vivo with CEUS-specific low MI pulses. The correlation coefficient is much lower than the theoretical predictions, indicating the presence of significant amounts of noise [51]. The correlation coefficient between channels is higher for MB signals than for tissue or incoherent noise, especially at “short lags”, i.e. when m is small. The SLSC beamformer quantifies this difference by measuring the area under the correlation coefficient curve at short lags, i.e., for 1 ≤ m ≤ M:
| (5) |
The selection of the threshold M is application-specific, but is typically selected to be anywhere from 1 to 30% of the transmit aperture size [42].
Fig. 1.

Examples of spatial coherence functions are plotted of a MB, tissue, and noise as a function of the element spacing m. The MB has greater spatial coherence than tissue, which has greater spatial coherence than noise. In this example of a 128 element transducer, the differences are most obvious when m < 40.
III. Methods
A. Microbubble Imaging System
A contrast pulse sequence (CPS) approach [29] was used to image the nonlinear response of the MBs, combined with a plane wave synthetic aperture technique. Three plane waves were transmitted at each of 7 angles over a span of 18° for a total of 21 pulses per image frame with a pulse repetition frequency of 10 kHz. Each triplet of pulses consisted of two cycle transmissions at 4.5 MHz with amplitudes of , such that the sum of the three pulses would cancel out the linear (i.e. tissue) component of the signal and accentuate the harmonic (i.e. MB) signal. The two half-amplitude pulses were achieved by transmitting using only the odd elements and the even elements, respectively, whereas the negative pulse was achieved with a waveform 180° out of phase, transmitted on all elements.
A Verasonics Vantage 256 research scanner was used to acquire the raw channel data from 128 elements of an L12-3v transducer in real time. The received echoes were bandpass filtered at the second harmonic frequency (9 MHz) to detect the non-linear MB response. The data was then transferred to a host computer for real-time processing. MATLAB (Mathworks, Natick, MA) MEX functions were written in C++/CUDA (NVIDIA, Santa Clara, CA) to perform beamforming using an NVIDIA Quadro K620 graphics processing unit (GPU). Each triplet of signals was first summed together to obtain the harmonic signal. The harmonic channel signals were then focused by applying the appropriate time delays and coherently summing over the 7 plane wave images. The focused channel signals were used to form both conventional CEUS and SLSC-CEUS images by applying (1) and (5), respectively. In this study, the short-lag threshold was empirically selected as M = 16, corresponding to 12.5% of the 128 element aperture, although image quality was observed to be fairly insensitive to small changes in M. Real-time image guidance was performed at > 20 frames per second (fps), and the data set to be analyzed was obtained at 100 fps.
B. Image Reconstruction and Analysis
Both the conventional CEUS and SLSC-CEUS images were normalized and displayed on a linear scale. To remove the background tissue signal, images were acquired before and after a strong destructive pulse, and the post-burst image was subtracted from the pre-burst image to form a difference image:
| (6) |
To decrease noise and improve stationary microbubble visualization, ten frames were averaged together for each of the pre-and post-burst images. The DAS and SLSC difference images were normalized by the root-mean-square (RMS) value of the noise floor as measured in a control region.
The MB sensitivity of each beamformer was measured as follows:
| (7) |
where RMS is the root-mean-square value, I is either the conventional CEUS or SLSC-CEUS difference image, and xMB and xtissue correspond to regions of interest (ROIs) of MB signal and background tissue signal, respectively.
The tissue ROI was selected as a region within the tumor with no visible MBs. The MB ROIs were selected using a semi-automated process. A reviewer manually marked the centers of all suspected MBs in each image. For every marked center, the image pixels were weighted by a gaussian function centered at the marked location and with a standard deviation of 15 pixels. For each image, the MB ROI was defined as any pixel whose weighted value exceeded 2 × RMS [I(xtissue)] for any of the marked centers. To avoid unfairly biasing ROI selection toward either technique, the final MB ROI was selected to only contain pixels that were classified as MB signal in both the conventional and SLSC-CEUS images.
C. Flow Channel Phantoms
Wall-less agarose flow phantoms were constructed in-house to emulate two common modalities of CEUS: USMI and perfusion imaging. The phantoms were made with an agar gel (2% weight-by-volume) mixed with graphite (2%) to generate tissue-mimicking scattering. The gel was poured into a customized mold lined with impedance-matching ρ−c rubber [52] and containing removable tubes and rods spanning from wall to wall. The tubes or rods were removed after the gel was fully cooled and set, leaving behind wall-less flow channels.
USMI was mimicked with a phantom containing nine 200 μm diameter microvessels arranged in a 2 mm diameter circle, creating the voids of the microvessels using a bundle of steel rods (McMaster-Carr part #89875K87) that were held together on one end with putty. A transverse cross-section was imaged to mimic the isolated MBs encountered in USMI. A solution containing clinical grade BR55 (Bracco, Milan), a MB contrast agent targeted to VEGFR2 [17], [53], was injected into the flow channels and held stationary using a syringe. BR55 was used as a non-targeted MB in the phantom studies because the phantoms did not contain VEGFR2 receptors. A fixed concentration of 5×104 MB/mL was injected into the microvessels. To characterize each beamforming method as a function of noise level, gaussian white noise was added to the signal at levels of −20, −12, −6, 0, +6, +12, and +20 dB relative to the RMS of the overall signal. SNR was measured using manually selected tissue and bubble ROIs, due to the movement of MBs in and out of plane. A B-mode image of the phantom is shown in Fig. 2a.
Fig. 2.

The imaging setup is shown for the phantom and in vivo experiments. (a) A transverse cross-section of the microvessel phantom, with the locations of the nine 200 μm flow channels marked. (b) A longitudinal cross-section of the 2 mm flow channel phantom. (c) The in vivo transducer and porcine muscle layer setup.
Perfusion imaging was mimicked using a 2 mm flow channel created using a 2 mm diameter plastic tube (Cole-Parmer part #06417-51) to create the void for the flow channel. The channel was imaged with a longitudinal cross-section to characterize the beamforming response to a bolus of MBs in an easily resolvable vessel as a function of MB concentration. A B-mode image of the phantom is shown in Fig. 2b. CEUS images were formed with concentrations of 5×10², 5×10³, 5×10⁴, 5×10⁵, and 5×106 MB/mL. SNR was measured using rectangular ROIs inside and just above the vessel.
D. Human HCC Xenografts in Mice
In vivo experiments were performed in a mouse model of hepatocellular carcinoma (HCC). Human HepG2 HCC cells (ATCC, Manassas, VA) were grown in high glucose (4.5 g/L) Dulbeccos modified Eagles medium (Invitrogen, Carlsbad, CA), supplemented with 10% fetal bovine serum, L-glutamine (2 mM), penicillin (100 U/mL), and streptomycin (100 μg/mL). Cells were incubated at 37° C in a humidified atmosphere of 5% CO2, and 95% air.
All in vivo experiments were performed in nude mice (Charles River, Hollister, CA) with prior approval from the Institutional Administrative Panel on Laboratory Animal Care. Cells at approximately 70% confluence were collected by trypsinization. Human HCC xenografts were established on the mouse flanks by subcutaneously injecting 5×10⁶ HepG2 cells mixed in 50 μL low growth factor matrigel membrane matrix (BD Biosciences, Billerica, MA). Tumors were allowed to grow for 3–4 weeks until they reached a mean maximum cross-sectional dimension of 9.1±1.5 mm. This cutoff was selected because tumors beyond 9 mm were observed to be necrotic in the center and to contain neovasculature that was no longer intact. A total of 10 mice with tumors were used in this study.
Prior to experimentation, the mice were anesthetized with 2% isoflurane in 2 L of oxygen per minute. A catheter (MicroMarker Tail Vein Access Cannulation kit; VisualSonics, Toronto, Ontario) was placed into a lateral tail vein for administration of MBs. A 50 μL bolus injection containing 5×10⁷ MBs was injected, and MBs were allowed to circulate through and accumulate in the tumor for 4 minutes postinjection. Images were acquired after the MBs had bound, and were denoted as having low or high MB retention (i.e., binding). Control images of the tissue were also obtained immediately following a high MI destructive pulse, before more circulating MBs could enter the tumor. Clinical imaging conditions were simulated by placing a 1 cm thick layer of degassed porcine muscle tissue between the transducer and the target [54], [55] to induce attenuation, aberration, and reverberation clutter. A B-mode image of the tumor and porcine tissue layout is shown in Fig. 2c. The SNR within the tumors was measured using manually selected ROIs of MBs and background tissue, as detailed in Section III-B.
IV. Results
A. USMI Phantom
Cross-sectional images from the microvessel phantom are shown in Fig. 3 for several levels of added gaussian white noise. The white bars indicate 1 mm in these and all subsequent images. In the absence of noise, the MBs were well-visualized by both conventional and SLSC-CEUS. In the presence of +6 dB noise, the conventional CEUS image showed weaker MB signals, whereas the SLSC-CEUS image visualized the MBs comparably to the no noise case. At +20 dB noise, both methods failed to visualize the most of the MBs. The remaining visible MBs appeared brighter in the SLSC-CEUS image.
Fig. 3.
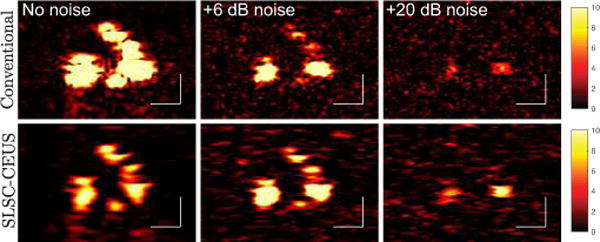
Cross-sections of the microvessel phantom are shown for (top) conventional CEUS and (bottom) SLSC-CEUS for three noise conditions. The left column shows the original images, and the middle and right columns display the results of adding +6 dB and +20 dB noise to the channel signals, respectively. All images display a dynamic range of 0 to 10 times the RMS of the background.
The imaging performance of each method is quantified as a function of added noise over several acquisitions in Fig. 4. In the absence of noise (−∞ dB), conventional CEUS (solid line) had significantly higher SNR than SLSC-CEUS (dashed line). The SNR of the conventional CEUS images decreased as noise was increased. By contrast, SLSC-CEUS (dashed line) showed comparable or improved performance for noises of up to +6 dB with respect to the overall signal. At noise levels at or above +6 dB, the SNR decreased sharply for both techniques, with SLSC-CEUS maintaining an SNR approximately 6 dB better than conventional CEUS.
Fig. 4.

The SNR in the microvessel phantom is plotted as a function of added noise level. SLSC-CEUS outperforms conventional CEUS under challenging noise conditions.
B. Perfusion Phantom
MBs were easily visible in the perfusion flow channel phantom for all MB concentrations. Figure 5 displays the conventional CEUS (top row) and the SLSC-CEUS (bottom row) images for increasing levels of MB concentration. MBs were not visible in the control (0MB/mL) images for either method as expected. At 5×102 MB/mL, the MB signal was low throughout the vessel for both methods. At 5×104 MB/mL, both methods resulted in an increased brightness and a speckle pattern visible inside the vessel. However, at 5×106 MB/mL only the conventional CEUS image continued to grow brighter, while SLSC-CEUS was approximately the same as 5×104 MB/mL.
Fig. 5.

Conventional (top row) and SLSC (bottom row) CEUS images are shown for the 2 mm vessel phantoms with increasing MB concentration from left to right. Bubble (magenta) and tissue (cyan) ROIs are plotted in the 0 MB/mL SLSC-CEUS image. The images display a dynamic range of 0 to 10 times the RMS of the background. Unlike conventional CEUS, SLSC-CEUS signal does not increase further at higher concentrations.
The mean MB signal and the SNR values are plotted in Fig. 6. The conventional CEUS MB signal increased linearly with the concentration of MBs, while the SLSC-CEUS MB signal plateaued beyond 5×104 MB/mL. The measured SNR showed similar trends for both techniques, with greater improvements by conventional CEUS at higher concentrations.
Fig. 6.
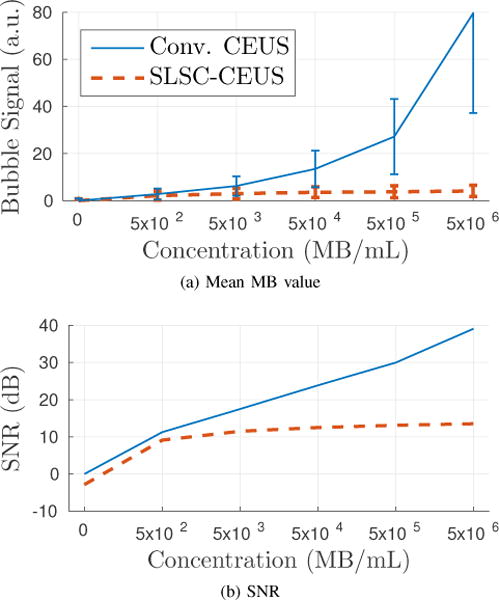
The mean MB signal and the SNR in the perfusion phantom are plotted as a function of MB concentration. Conventional CEUS gives a linear increase in SNR, whereas SLSC-CEUS plateaus at higher concentrations.
C. In Vivo Experiments
Four examples of low MB retention in HCC tumors are shown in Fig. 7. All images are scaled to display a dynamic range of 1 to 5 times the RMS of the background ROI, denoted in magenta. Overall, the SLSC-CEUS images showed greater MB signal and suppressed salt-and-pepper noise throughout the tumor. In image A, SLSC-CEUS enhanced four MBs located in the center of the image and two MBs on the left side of the tumor relative to the tumor background. In image B, clusters of MBs near the center of the tumor and on the left side were enhanced in the SLSC-CEUS image. In images C and D, the SLSC-CEUS technique strongly visualized the MBs deep inside the tumor while suppressing background noise from within the tissue.
Fig. 7.

CEUS images are shown of low MB retention in four subcutaneous tumors in four different mice. CEUS difference images were formed using the conventional (top row) and SLSC (middle row) techniques. The bottom row plots the MB and tissue ROIs used for each image. The white bars denote 1 mm, and the white arrows outline the tumor. The images display a dynamic range of 1 to 5 times the RMS of the tissue signal, as measured in the porcine layer above the tumor. SLSC-CEUS enhances the MB signal while reducing noise in the surrounding tissue. Notable improvements are highlighted with blue arrows.
Four examples of high MB retention are shown in Fig. 8 with a dynamic range of 1 to 5 times the RMS of the background ROI, denoted in magenta. In the conventional CEUS images, salt-and-pepper noise was present throughout, both inside and outside of the tumors, making it difficult to distinguish MB from noise. By contrast, the SLSC-CEUS images substantially suppressed the noise while preserving and enhancing the MB signals throughout. This effect was especially remarkable in image D, where the noise masked the MB signal in the conventional CEUS image.
Fig. 8.

CEUS images are shown of high MB retention in four subcutaneous tumors in four different mice. CEUS difference images were formed using the conventional (top row) and SLSC (middle row) techniques. The bottom row plots the MB and tissue ROIs used for each image. The white bars denote 1 mm, and the images display a dynamic range of 1 to 5 times the RMS of the tissue, as measured in the porcine layer above the tumor.
The SNR for MB signal in all tumors, as measured by the ratio of the MB ROI to the background ROI, is plotted in Fig. 9, with the conventional CEUS SNR on the x-axis and SLSC-CEUS on the y-axis. In each case, the SNR was higher in SLSC-CEUS than in conventional CEUS. The average improvement in SNR was 41%, corresponding to a 3.0 dB SNR increase.
Fig. 9.

The sensitivities of the SLSC-CEUS images are plotted against those of the conventional CEUS images. SLSC-CEUS improved the SNR in each of 10 separate acquisitions with varying levels of MB retention in the tumor.
V. Discussion
Throughout the results above, SLSC-CEUS showed greater sensitivity to isolated MBs than conventional CEUS. Specifically, SLSC-CEUS reduced noise and accentuated the MB signal throughout the image. In theory, DAS and SLSC both give maximum output for a point scatterer such as an isolated MB. With DAS, the coherent signal from an ideal point scatterer signal sums constructively over the aperture, ideally yielding an N-fold increase. With SLSC, the correlation coefficient is measured to be unity at all lags, and the short-lag sum is thereby maximized.
SLSC, however, is less sensitive to changes in signal quality than DAS. For example, SLSC is insensitive in its response to signal degradation caused by attenuation and incoherent noise (i.e. more robust), but it is also insensitive to increases in signal strength. This characteristic makes SLSC very well-suited for low SNR applications such as isolated MB detection in USMI, but less well-suited for high SNR applications, such as perfusion imaging. Below, the characteristic responses of each beamformer are discussed for several scenarios affecting the signal quality.
A. Effects of Attenuation
Attenuation is caused by the absorption of acoustic energy by the tissue. The transmitted pulse and reflected echoes lose strength progressively as they travel through the medium. Attenuation has an immediate impact on DAS because its output is directly proportional to the magnitude of the echo, causing deeper regions to appear darker. (Time-gain compensation counteracts this issue by amplifying the signal, but also amplifies the noise level in the process.)
Attenuation has a subtler effect on SLSC that is readily demonstrated with a simple example. Consider two noisy signals x and y, composed of the true signals sx and sy degraded by uncorrelated additive noises nx and ny:
| (8a) |
| (8b) |
It can be shown (see Appendix) that ρxy, the correlation coefficient between x and y, is related to , the correlation coefficient between sx and sy, by
| (9) |
where σs and σn are the magnitudes of the signals and noises, respectively, and ESNR is the electronic signal-to-noise ratio. A plot is shown in Fig. 10 for convenience. Equation (9) shows that as σs is reduced (i.e. by attenuation), the measured correlation coefficient decreases. However, unlike DAS, the correlation coefficient follows a nonlinear trend; a reduction in σs has little impact on ρxy when σs ≫ σn, but has a dramatic impact when σs ≪ σn. Provided that the MB signal is strong relative to the noise magnitude, the correlation coefficient (and thereby SLSC) is robust to attenuation effects. This behavior was observed in the low retention in vivo images in Fig. 7, especially in images C and D where the MBs deep within the tumor were well visualized by SLSC-CEUS but not by conventional CEUS. This suggests that SLSC-CEUS can achieve deeper penetration than conventional CEUS.
Fig. 10.

The measured correlation coefficient is affected by the SNR according to the plotted weights.
B. Effects of Incoherent Noise
Incoherent noise also affects both beamformers. The noise can arise from electronic sources (e.g., thermal noise) or from acoustical sources, such as multi-path scattering within the tissue. In DAS images, incoherent noise manifests as salt-and-pepper noise overlaying the image. Because the output of DAS is the magnitude of the signal, an increase in the noise level σn tends to increase the overall output, with the noise dominating the signal at high amplitudes.
By contrast, the output of the SLSC beamformer is essentially a correlation coefficient, and tends to decrease with noise, especially when no strong signal is present. Equation (9) shows that there is a suppression of coherence as noise (σn) is increased, and that the suppression is more severe when σs is small (e.g., no MB signal) than when σs is large (e.g., a MB signal). This nonlinear behavior selectively suppresses incoherent noise more sharply than the MB signals, enhancing the image. This effect was apparent in the high retention in vivo images in Fig. 8, where the noise present throughout the conventional CEUS images was significantly suppressed in the SLSC-CEUS images. Some signals were observed in the distal regions of the tumors in the conventional CEUS images A, B, and C that did not appear in the SLSC-CEUS images. It is difficult to classify these as either MBs or noise in the absence of a ground truth. However, their high amplitude and low spatial coherence are consistent with noise that mimics desired targets of interest (e.g., tissue) we have seen in other applications [49], [56].
C. Effects of Increasing MB Concentration
In the event that multiple MBs are insonified simultaneously, the echoes interfere with one another. Given enough MBs within the smallest resolvable volume (and assuming that the response from each MB is independent of the rest), the interference between the echoes manifests as a speckle signal. The DAS response to a speckle signal has been studied extensively [57]. The mean DAS output of a speckle signal increases linearly with the magnitude of the echo, making DAS very well suited for perfusion imaging.
The SLSC beamformer, however, interprets multiple MBs (and speckle in general) as a fundamental loss in correlation [43]. In (9), this corresponds to a reduction in Increasing the MB concentration and thereby the signal strength σs causes the correlation coefficient ρxy to asymptotically approach , but not increase past it. Therefore, there is a limit to the maximum observable coherence when many MBs manifest as speckle. This effect was observed in the perfusion phantom in Figs. 5 and 6, where the SLSC output is seen to plateau at higher concentrations. Moreover, SLSC is composed of normalized correlation coefficients and is thus insensitive to pure increases or decreases in magnitude. Consequently, SLSC is poorly suited for high MB concentration applications such as perfusion imaging for precisely the same reason that it excels in low MB concentration applications such as USMI.
Notably, SLSC-CEUS performance in vivo did not appear to suffer from the same signal saturation effect that was observed in the perfusion phantom study, even at the highest levels of MB retention (Fig. 9). The high MB retention images in Fig. 8 do not demonstrate a speckle-like texture in the MB regions. The lack of speckle artifact indicates a low concentration of bound MBs, which was one of the original motivating factors for developing a more sensitive USMI technique.
D. Other Remarks
SLSC is an aperture domain technique, operating on the channel signals. A major benefit of this is that it is mostly independent of pulse sequencing and image processing, and can build upon the technological advances of either. Plane wave transmits and CPS harmonic imaging were selected for this study, but could easily be replaced with focused or diverging wave transmits with a standard pulse-inversion harmonic imaging technique.
The resolution of SLSC-CEUS depends on many parameters (e.g., M, electronic SNR) [58] and was not investigated in this study. However, a slight loss in lateral resolution was observed with the selected parameters.
The nonlinear properties of SLSC make it useful for detection tasks; however, SLSC is consequently poorly suited for applications where the linearity in the signal power needs to be preserved with respect to MB concentration (e.g., quantification as opposed to detection).
VI. Conclusion
In this study, the DAS and SLSC beamformers were compared in the context of CEUS. Conventional CEUS images of the backscattered magnitude were made with DAS, and SLSC-CEUS images of the backscattered spatial coherence with SLSC. SLSC-CEUS images exhibited significantly improved sensitivity to isolated MBs in a microvessel phantom emulating targeted imaging, but was insensitive to increases in the concentration of MBs in perfusion imaging. In vivo, SLSC-CEUS improved the sensitivity to VEGFR2-targeted MBs in every acquisition, with an average increase of 41% in SNR. SLSC was found to be robust to noisy imaging conditions, and appears to be particularly well suited for MB detection in low concentration imaging applications such as USMI, but poorly suited for quantifying increases in MB concentration in applications such as perfusion imaging.
Acknowledgments
This research was supported by the National Institute of Biomedical Imaging and Bioengineering grants R01-EB013661 and R21-EB022770 and the Canary Center at Stanford for Cancer Early Detection.
Appendix
Consider two noisy signals x and y, composed of the true signals sx and sy degraded by uncorrelated additive noises nx and ny:
| (10a) |
| (10b) |
Their correlation coefficient is computed as
| (11) |
Let us assume that the expected magnitudes of sx and sy and of nx and ny are the same, i.e.,
| (12a) |
| (12b) |
| (12c) |
We then have
| (13) |
The correlation coefficient can also be written as a function of the electronic SNR, defined as ESNR = σs/σn:
| (14) |
Thus, we see that ρxy approaches asympotically as ESNR is increased.
Contributor Information
Dongwoon Hyun, Department of Radiology, Stanford University School of Medicine, Stanford, CA 94305 USA.
Lotfi Abou-Elkacsem, Department of Radiology, Stanford University School of Medicine, Stanford, CA 94305 USA.
Valerie A. Perez, Department of Chemical Engineering, Stanford University, Stanford, CA 94305 USA
Sayan Mullick Chowdhury, Department of Radiology, Stanford University School of Medicine, Stanford, CA 94305 USA.
Juergen K. Willmann, Department of Radiology, Stanford University School of Medicine, Stanford, CA 94305 USA
Jeremy J. Dahl, Department of Radiology, Stanford University School of Medicine, Stanford, CA 94305 USA
References
- 1.Klibanov AL, Hossack JA. Ultrasound in Radiology: From Anatomic, Functional, Molecular Imaging to Drug Delivery and Image-Guided Therapy. Investigative Radiology. 2015;50(9):657–670. doi: 10.1097/RLI.0000000000000188. [DOI] [PMC free article] [PubMed] [Google Scholar]
- 2.Pellikka PA, Nagueh SF, Elhendy AA, Kuehl CA, Sawada SG. American Society of Echocardiography Recommendations for Performance, Interpretation, and Application of Stress Echocardiography. Journal of the American Society of Echocardiography. 2007;20(9):1021–1041. doi: 10.1016/j.echo.2007.07.003. [DOI] [PubMed] [Google Scholar]
- 3.Senior P, Jeetley R. Clinical Echocardiography. In: Nihoyannopoulos P, Kisslo J, editors. Echocardiography SE. Vol. 15. Springer; London: 2009. pp. 313–324. [Google Scholar]
- 4.Burns PN, Wilson SR, Simpson DH. Pulse inversion imaging of liver blood flow: improved method for characterizing focal masses with microbubble contrast. Investigative Radiology. 2000;35(1):58–71. doi: 10.1097/00004424-200001000-00007. [DOI] [PubMed] [Google Scholar]
- 5.Harvey CJ, Blomley MJ, Eckersley RJ, Heckemann RA, Butler-Barnes J, Cosgrove DO. Pulse-inversion mode imaging of liver specific microbubbles: improved detection of subcentimetre metastases. Lancet (London, England) 2000;355(9206):807–8. doi: 10.1016/S0140-6736(99)04545-6. [DOI] [PubMed] [Google Scholar]
- 6.Correas J-M, Claudon M, Tranquart F, Hélénon O. The kidney: imaging with microbubble contrast agents. Ultrasound Quarterly. 2006;22(1):53–66. [PubMed] [Google Scholar]
- 7.Chaudhari MH, Forsberg F, Voodarla A, Saikali FN, Goonewardene S, Needleman L, Finkel GC, Goldberg BB. Breast tumor vascularity identified by contrast enhanced ultrasound and pathology: Initial results. Ultrasonics. 2000;38(1):105–109. doi: 10.1016/s0041-624x(99)00146-8. [DOI] [PubMed] [Google Scholar]
- 8.Cosgrove D. Ultrasound contrast agents: An overview. European Journal of Radiology. 2006;60(3):324–330. doi: 10.1016/j.ejrad.2006.06.022. [DOI] [PubMed] [Google Scholar]
- 9.Quaia E. Microbubble ultrasound contrast agents: An update. European Radiology. 2007;17(8):1995–2008. doi: 10.1007/s00330-007-0623-0. [DOI] [PubMed] [Google Scholar]
- 10.Ferrara K, Pollard R, Borden M. Ultrasound microbubble contrast agents: fundamentals and application to gene and drug delivery. Annual Review of Biomedical Engineering. 2007;9:415–447. doi: 10.1146/annurev.bioeng.8.061505.095852. [DOI] [PubMed] [Google Scholar]
- 11.Correas JM, Bridal L, Lesavre A, Mejean A, Claudon M, Hélenon O. Ultrasound contrast agents: Properties, principles of action, tolerance, and artifacts. European Radiology. 2001;11(8):1316–1328. doi: 10.1007/s003300100940. [DOI] [PubMed] [Google Scholar]
- 12.Qin S, Caskey CF, Ferrara KW. Ultrasound contrast microbubbles in imaging and therapy: physical principles and engineering. Physics in Medicine and Biology. 2009;54(6):R27–57. doi: 10.1088/0031-9155/54/6/R01. [DOI] [PMC free article] [PubMed] [Google Scholar]
- 13.Ferrara N, Gerber H-P, LeCouter J. The biology of VEGF and its receptors. Nature Medicine. 2003;9(6):669–76. doi: 10.1038/nm0603-669. [DOI] [PubMed] [Google Scholar]
- 14.Willmann JK, Paulmurugan R, Chen K, Gheysens O, Rodriguez-Porcel M, Lutz AM, Chen IY, Chen X, Gambhir SS. US imaging of tumor angiogenesis with microbubbles targeted to vascular endothelial growth factor receptor type 2 in mice. Radiology. 2008;246(2):508–518. doi: 10.1148/radiol.2462070536. [DOI] [PMC free article] [PubMed] [Google Scholar]
- 15.Korpanty G, Carbon JG, Grayburn PA, Fleming JB, Brekken RA. Monitoring response to anticancer therapy by targeting microbubbles to tumor vasculature. Clinical Cancer Research. 2007;13(1):323–330. doi: 10.1158/1078-0432.CCR-06-1313. [DOI] [PubMed] [Google Scholar]
- 16.Lee DJ, Lyshchik A, Huamani J. Relationship between retention of a vascular endothelial growth factor receptor 2 (VEGFR2)-targeted ultrasonographic contrast agent and the level of VEGFR2 expression in an in vivo breast cancer model. Journal of Ultrasound in Medicine. 2008;2:855–866. doi: 10.7863/jum.2008.27.6.855. [DOI] [PubMed] [Google Scholar]
- 17.Pysz MA, Foygel K, Rosenberg J, Gambhir SS, Schneider M, Willmann JK. Antiangiogenic Cancer Therapy: Monitoring with Molecular US and a Clinically Translatable Contrast Agent (BR55) Radiology. 2010 doi: 10.1148/radiol.10091858. [DOI] [PMC free article] [PubMed] [Google Scholar]
- 18.Anderson CR, Rychak JJ, Backer M, Backer J, Ley K, Klibanov AL. scVEGF microbubble ultrasound contrast agents: a novel probe for ultrasound molecular imaging of tumor angiogenesis. Investigative Radiology. 2010;45(10):579–585. doi: 10.1097/RLI.0b013e3181efd581. [DOI] [PMC free article] [PubMed] [Google Scholar]
- 19.Fischer T, Thomas A, Tardy I, Schneider M, Hünigen H, Custodis P, Beyersdorff D, Plendl J, Schnorr J, Diekmann F, Gemeinhardt O. Vascular endothelial growth factor receptor 2-specific microbubbles for molecular ultrasound detection of prostate cancer in a rat model. Investigative Radiology. 2010;45(10):675–684. doi: 10.1097/RLI.0b013e3181efd6b2. [DOI] [PubMed] [Google Scholar]
- 20.Bzyl J, Lederle W, Rix A, Grouls C, Tardy I, Pochon S, Siepmann M, Penzkofer T, Schneider M, Kiessling F, Palmowski M. Molecular and functional ultrasound imaging in differently aggressive breast cancer xenografts using two novel ultrasound contrast agents (BR55 and BR38) European Radiology. 2011;21(9):1988–1995. doi: 10.1007/s00330-011-2138-y. [DOI] [PubMed] [Google Scholar]
- 21.Bachawal SV, Jensen KC, Lutz AM, Gambhir SS, Tranquart F, Tian L, Willmann JK. Earlier detection of breast cancer with ultrasound molecular imaging in a transgenic mouse model. Cancer Research. 2013;73(6):1689–1698. doi: 10.1158/0008-5472.CAN-12-3391. [DOI] [PMC free article] [PubMed] [Google Scholar]
- 22.Bzyl J, Palmowski M, Rix A, Arns S, Hyvelin JM, Pochon S, Ehling J, Schrading S, Kiessling F, Lederle W. The high angiogenic activity in very early breast cancer enables reliable imaging with VEGFR2-targeted microbubbles (BR55) European Radiology. 2013;23(2):468–475. doi: 10.1007/s00330-012-2594-z. [DOI] [PubMed] [Google Scholar]
- 23.Pysz MA, Machtaler SB, Seeley ES, Lee JJ, Brentnall TA, Rosenberg J, Tranquart F, Willmann JK. Vascular Endothelial Growth Factor Receptor Type 2targeted Contrast-enhanced US of Pancreatic Cancer Neovasculature in a Genetically Engineered Mouse Model: Potential for Earlier Detection. Radiology. 2015;274(3):790–799. doi: 10.1148/radiol.14140568. [DOI] [PMC free article] [PubMed] [Google Scholar]
- 24.Barua A, Yellapa A, Bahr JM, Machado SA, Bitterman P, Basu S, Sharma S, Abramowicz JS. VEGFR2-Targeted Ultrasound Imaging Agent Enhances the Detection of Ovarian Tumors at Early Stage in Laying Hens, a Preclinical Model of Spontaneous Ovarian Cancer. Ultrasonic Imaging. 2015;37(3):224–237. doi: 10.1177/0161734614553603. [DOI] [PubMed] [Google Scholar]
- 25.Willmann JK, Bonomo L, Testa A Carla, Rinaldi P, Rindi G, Valluru KS, Petrone G, Martini M, Lutz AM, Gambhir SS. Ultrasound Molecular Imaging With BR55 in Patients With Breast and Ovarian Lesions: First-in-Human Results. Journal of Clinical Oncology. 2017 doi: 10.1200/JCO.2016.70.8594. p JCO.2016.70.859. [DOI] [PMC free article] [PubMed] [Google Scholar]
- 26.Pinton GF, Trahey GE, Dahl JJ. Sources of image degradation in fundamental and harmonic ultrasound imaging: a nonlinear, full-wave, simulation study. IEEE Transactions on Ultrasonics, Ferroelectrics, and Frequency Control. 2011;58(6):1272–83. doi: 10.1109/TUFFC.2011.1938. [DOI] [PMC free article] [PubMed] [Google Scholar]
- 27.Food and Drug Administration. Guidance for Industry and FDA Staff: Information for Manufacturers Seeking Marketing Clearance of Diagnostic Ultrasound Systems and Transducers. Silver Spring, MD. 2008:1–64. [Google Scholar]
- 28.Nelson TR, Fowlkes JB. Ultrasound Biosafety Considerations for the Practicing Sonographer and Sonologist. 2009:139–150. doi: 10.7863/jum.2009.28.2.139. [DOI] [PubMed] [Google Scholar]
- 29.Phillips P. Contrast pulse sequences (CPS): imaging nonlinear microbubbles. 2001 IEEE Ultrasonics Symposium Proceedings An International Symposium (Cat No.01CH37263) 2001;2:1739–1745. [Google Scholar]
- 30.Forsberg F, Shi WT, Goldberg BB. Subharmonic imaging of contrast agents. Ultrasonics. 2000;38(1):93–98. doi: 10.1016/s0041-624x(99)00148-1. [DOI] [PubMed] [Google Scholar]
- 31.Gessner RC, Aylward SR, Dayton PA. Mapping microvasculature with acoustic angiography yields quantifiable differences between healthy and tumor-bearing tissue volumes in a rodent model. Radiology. 2012;264(3):733–40. doi: 10.1148/radiol.12112000. [DOI] [PMC free article] [PubMed] [Google Scholar]
- 32.Hu X, Caskey CF, Mahakian LM, Kruse DE, Beegle JR, Declèves A-E, Rychak JJ, Sutcliffe PL, Sharma K, Ferrara KW. In vivo validation and 3D visualization of broadband ultrasound molecular imaging. American Journal of Nuclear Medicine and Molecular Imaging. 2013;3(4):336–49. [PMC free article] [PubMed] [Google Scholar]
- 33.Couture O, Fink M, Tanter M. Ultrasound contrast plane wave imaging. IEEE Transactions on Ultrasonics, Ferroelectrics, and Frequency Control. 2012;59(12):2676–2683. doi: 10.1109/TUFFC.2012.2508. [DOI] [PubMed] [Google Scholar]
- 34.Viti J, Vos H, De Jong N, Guidi F, Tortoli P. Detection of Contrast Agents: Plane Wave vs Focused Transmission. IEEE Transactions on Ultrasonics, Ferroelectrics, and Frequency Control. 2016;63(2):203–211. doi: 10.1109/TUFFC.2015.2504546. [DOI] [PubMed] [Google Scholar]
- 35.Dayton P, Klibanov A, Brandenburger G, Ferrara K. Acoustic radiation force in vivo: A mechanism to assist targeting of microbubbles. Ultrasound in Medicine and Biology. 1999;25(8):1195–1201. doi: 10.1016/s0301-5629(99)00062-9. [DOI] [PubMed] [Google Scholar]
- 36.Rychak JJ, Klibanov AL, Ley KF, Hossack JA. Enhanced Targeting of Ultrasound Contrast Agents Using Acoustic Radiation Force. Ultrasound in Medicine and Biology. 2007;33(7):1132–1139. doi: 10.1016/j.ultrasmedbio.2007.01.005. [DOI] [PubMed] [Google Scholar]
- 37.Deshpande N, Needles A, Willmann JK. Molecular ultrasound imaging: current status and future directions. Clinical Radiology. 2010;65(7):567–581. doi: 10.1016/j.crad.2010.02.013. [DOI] [PMC free article] [PubMed] [Google Scholar]
- 38.Pysz MA, Guracar I, Tian L, Willmann JK. Fast microbubble dwell-time based ultrasonic molecular imaging approach for quantification and monitoring of angiogenesis in cancer. Quant Imaging Med Surg. 2012;2(2):68–80. doi: 10.3978/j.issn.2223-4292.2012.06.05. [DOI] [PMC free article] [PubMed] [Google Scholar]
- 39.Burckhardt CB. Speckle in ultrasound B-mode scans. IEEE Transctions on Sonics and Ultrasonics. 1978;25(1):1–6. [Google Scholar]
- 40.Lediju MA, Pihl MJ, Dahl JJ, Trahey GE. Quantitative assessment of the magnitude, impact and spatial extent of ultrasonic clutter. Ultrasonic Imaging. 2008;30(3):151–68. doi: 10.1177/016173460803000302. [DOI] [PMC free article] [PubMed] [Google Scholar]
- 41.Trahey GE, Smith SW. Properties of acoustical speckle in the presence of phase aberration part I: first order statistics. Ultrasonic Imaging. 1988;28(1):12–28. doi: 10.1177/016173468801000102. [DOI] [PubMed] [Google Scholar]
- 42.Lediju MA, Trahey GE, Byram BC, Dahl JJ. Short-lag spatial coherence of backscattered echoes: imaging characteristics. IEEE Transactions on Ultrasonics, Ferroelectrics, and Frequency Control. 2011;58(7):1377–88. doi: 10.1109/TUFFC.2011.1957. [DOI] [PMC free article] [PubMed] [Google Scholar]
- 43.Mallart R, Fink M. The van Cittert-Zernike theorem in pulse echo measurements. The Journal of the Acoustical Society of America. 1991;90(5):2718–2727. [Google Scholar]
- 44.Fedewa RJ, Wallace KD, Holland MR, Jago JR, Ng GC, Rielly MR, Robinson BS, Miller JG. Spatial coherence of the nonlinearly generated second harmonic portion of backscatter for a clinical imaging system. IEEE Transactions on Ultrasonics, Ferroelectrics, and Frequency Control. 2003;50(8):1010–1022. doi: 10.1109/tuffc.2003.1226545. [DOI] [PubMed] [Google Scholar]
- 45.Bottenus NB, Trahey GE. Equivalence of time and aperture domain additive noise in ultrasound coherence. The Journal of the Acoustical Society of America. 2015;137(1):132–138. doi: 10.1121/1.4904530. [DOI] [PMC free article] [PubMed] [Google Scholar]
- 46.Dahl JJ, Hyun D, Lediju M, Trahey GE. Lesion detectability in diagnostic ultrasound with short-lag spatial coherence imaging. Ultrasonic Imaging. 2011;33(2):119–133. doi: 10.1177/016173461103300203. [DOI] [PMC free article] [PubMed] [Google Scholar]
- 47.Jakovljevic M, Trahey GE, Nelson RC, Dahl JJ. In vivo application of short-lag spatial coherence imaging in human liver. Ultrasound in Medicine & Biology. 2013;39(3):534–542. doi: 10.1016/j.ultrasmedbio.2012.09.022. [DOI] [PMC free article] [PubMed] [Google Scholar]
- 48.Dahl JJ, Jakovljevic M, Pinton GF, Trahey GE. Harmonic Spatial Coherence Imaging: An Ultrasonic Imaging Method Based on Backscatter Coherence. IEEE Transactions on Ultrasonics, Ferroelectrics, and Frequency Control. 2012;59(4):648–59. doi: 10.1109/TUFFC.2012.2243. [DOI] [PMC free article] [PubMed] [Google Scholar]
- 49.Kakkad V, Dahl J, Ellestad S, Trahey G. In Vivo Application of Short-Lag Spatial Coherence and Harmonic Spatial Coherence Imaging in Fetal Ultrasound. Ultrasonic Imaging. 2015;37(2):101–116. doi: 10.1177/0161734614547281. [DOI] [PMC free article] [PubMed] [Google Scholar]
- 50.Hyun D, Crowley ALC, Dahl JJ. Efficient Strategies for Estimating the Spatial Coherence of Backscatter. IEEE Transactions on Ultrasonics, Ferroelectrics, and Frequency Control. 2017;64(3):500–513. doi: 10.1109/TUFFC.2016.2634004. [DOI] [PMC free article] [PubMed] [Google Scholar]
- 51.Pinton GF, Trahey GE, Dahl JJ. Spatial Coherence in Human Tissue : Implications for Imaging and Measurement. IEEE Transactions on Ultrasonics, Ferroelectrics, and Frequency Control. 2014;61(12):1976–1987. doi: 10.1109/TUFFC.2014.006362. [DOI] [PMC free article] [PubMed] [Google Scholar]
- 52.Adair LC, Cook RL. Acoustic Properties of Rho-C Rubber and ABS* in the Frequency Range 100 kHz-2 Mhz. The Journal of the Acoustical Society of America. 1973;1763(1973):1763–1765. [Google Scholar]
- 53.Pochon S, Tardy I, Bussat P, Bettinger T, Brochot J, von Wronski M, Passantino L, Schneider M. BR55: A Lipopeptide-Based VEGFR2-Targeted Ultrasound Contrast Agent for Molecular Imaging of Angiogenesis. Investigative Radiology. 2010;45(2):89–95. doi: 10.1097/RLI.0b013e3181c5927c. [DOI] [PubMed] [Google Scholar]
- 54.Carrascal C Amador, Aristizabal S, Greenleaf JF, Urban MW. Phase Aberration and Attenuation Effects on Acoustic Radiation Force-Based Shear Wave Generation. IEEE Transactions on Ultrasonics, Ferroelectrics, and Frequency Control. 2016;63(2):222–232. doi: 10.1109/TUFFC.2016.2515366. [DOI] [PMC free article] [PubMed] [Google Scholar]
- 55.Correia M, Provost J, Chatelin S, Villemain O, Tanter M, Pernot M. Ultrafast Harmonic Coherent Compound (UHCC) Imaging for High Frame Rate Echocardiography and Shear-Wave Elastography. IEEE Transactions on Ultrasonics, Ferroelectrics, and Frequency Control. 2016;63(3):420–431. doi: 10.1109/TUFFC.2016.2530408. [DOI] [PMC free article] [PubMed] [Google Scholar]
- 56.Dahl JJ, Sheth NM. Reverberation Clutter from Subcutaneous Tissue Layers: Simulation and in Vivo Demonstrations. Ultrasound in Medicine & Biology. 2014;40(4):714–726. doi: 10.1016/j.ultrasmedbio.2013.11.029. [DOI] [PMC free article] [PubMed] [Google Scholar]
- 57.Goodman JW. Speckle phenomena in optics: theory and applications. Roberts & Company; 2007. [Google Scholar]
- 58.Lediju Bell MA, Dahl JJ, Trahey GE. Resolution and brightness characteristics of short-lag spatial coherence (SLSC) images. IEEE Transactions on Ultrasonics, Ferroelectrics, and Frequency Control. 2015;62(7):1265–1276. doi: 10.1109/TUFFC.2014.006909. [DOI] [PMC free article] [PubMed] [Google Scholar]