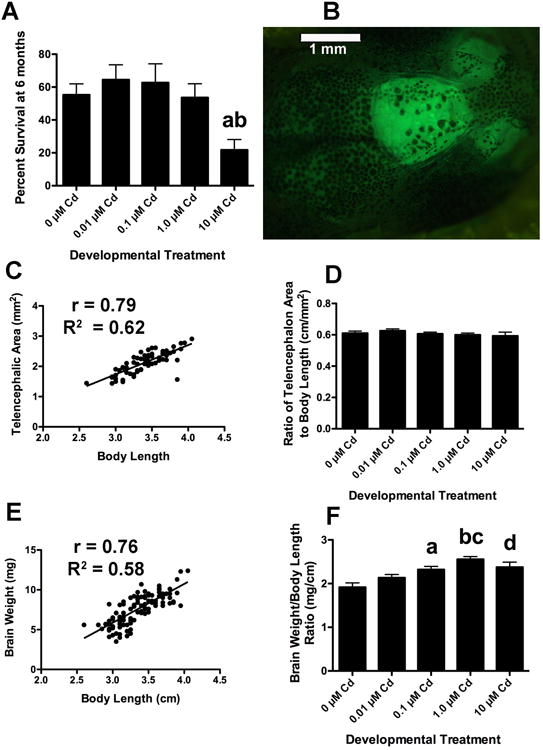
Figure 4. Developmental Cd exposure affects survival and brain size in longitudinal adult fish.

Fish treated with 10 μM CdCl2 during development showed significantly lower survival at 6 months than untreated controls (4A). This experiment was carried out a minimum of 6 times for each treatment group (a: p < 0.05 when compared to the 0 μM, 0.1 μM and 1.0 μM groups and b: p < 0.01 compared to the 0.01 μM group). The telencephalons of longitudinal adult GFP+ fish were imaged and the area measured as described in methods (4B). Body length and telencephalic area are strongly correlated (3C, p < 0.0001, n = 152). The telencephalon to body length ratio (TA/BL) did not vary significantly between the different longitudinal treatment groups (4D this experiment was done 3 times with an n = 35 for each Cd group, except the 10 μM Cd, which had much lower survival and an n = 10, p < 0.52). However, the shape of the concentration response curve was similar to that for survival (4A) and larval telencephalic area (2C), with a slight, but statistically insignificant, increase at the lower concentrations (0.01 μM), and a decrease at higher concentrations (1.0 and 10 μM). Brain weight was strongly correlated with body length when all groups were considered together (3E, p < 0.0001, n = 103). The brain weight to body length ratio differed between CdCl2 treatment groups. Fish treated with 0.1 μM, 1.0 μM and 10 μM CdCl2 during development had proportionally heavier brains than untreated controls (n = 21-24 for each Cd group except the 10 μM group, which had an n =12, a: p < 0.01 compared to the 0 μM group, b: p < 0.001 compared to the 0 μM group, c: p < 0.01 when compared to the 0.01 μM group and d: p < 0.05 compared to the 1.0 μM fish).
