
Figure 3.
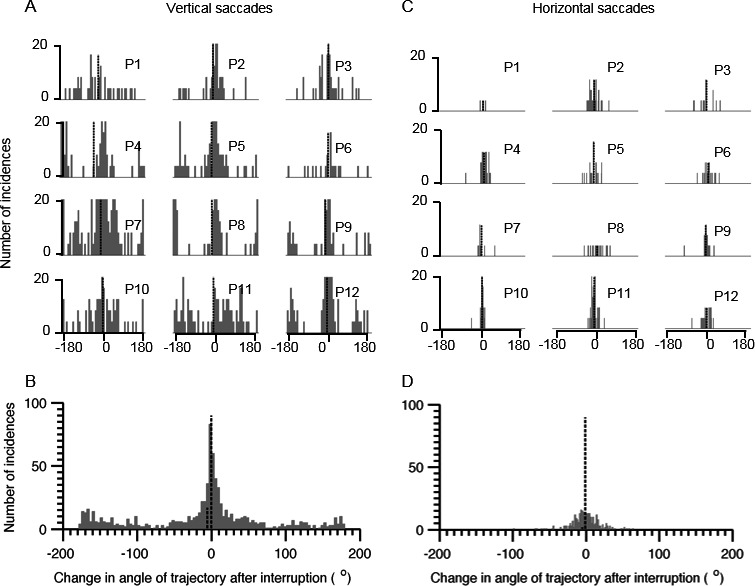
Summary of changes in the angle of trajectory after interruption of horizontal and vertical saccades in progressive supranuclear palsy PSP). The left column (A,B) depicts vertical saccades, and the right column (C,D) illustrates horizontal saccades. Histograms in A and C depict individual patients labeled from Patient 1 (P1) through P12. The histograms in B and D provide a cumulative summary of changes in the trajectory angle from all participants. Angle of zero degrees suggests no change in saccades trajectory after the interruption, and nonzero values suggest a change in the trajectory. The x‐axis depicts bins of trajectory angles, and the y‐axis indicates the number of incidences in the given bin. Tall and short vertical dashed lines indicate mean and median values, respectively.