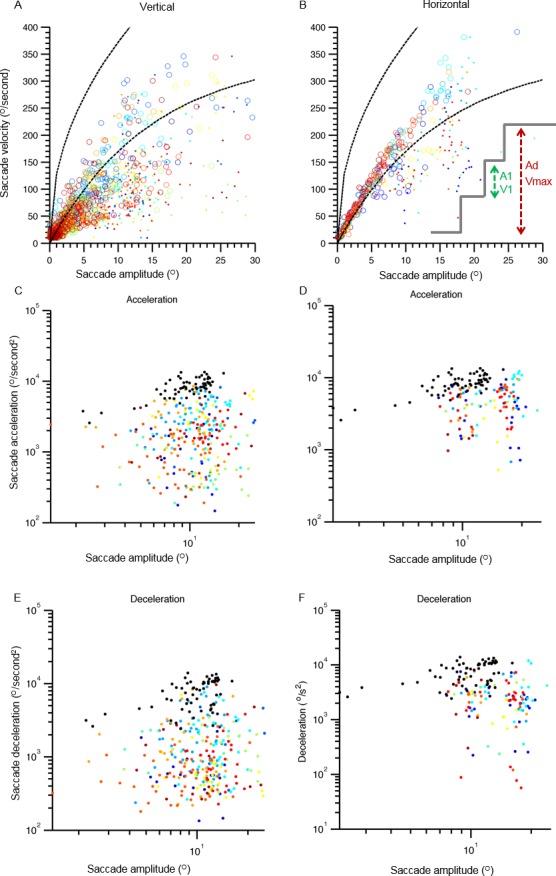
Figure 4.

Comparison of saccade velocity and corresponding amplitude in main sequence analysis for vertical (A) and horizontal (B) saccades. Saccade velocity is plotted on the y‐axis, and the x‐axis depicts saccade amplitude. Each color depicts 1 individual, and each symbol depicts 1 saccade. Solid symbols depict the relationship of peak saccade velocity with the desired amplitude of saccade, and open symbols show the relationship between the amplitude of the broken segment of the saccade and the corresponding velocity. Dashed black lines indicate the normative range. (C,D) Saccade acceleration and the corresponding amplitude for vertical and horizontal saccades are compared. (E,F) A similar comparison for saccade deceleration is depicted. Acceleration or deceleration is plotted on y‐axis, and the corresponding amplitude is plotted on the x‐axis. Each color depicts 1 individual, and each symbol is 1 saccade. Black symbols represent data from normal individuals. The inset in B schematizes the analysis scheme. Green arrows depict a segmented saccade, A1 is the amplitude of segmented saccade, and V1 is corresponding velocity. The red arrows indicate the desired saccade amplitude (Ad). Vmax is the maximal velocity during entire saccade.
