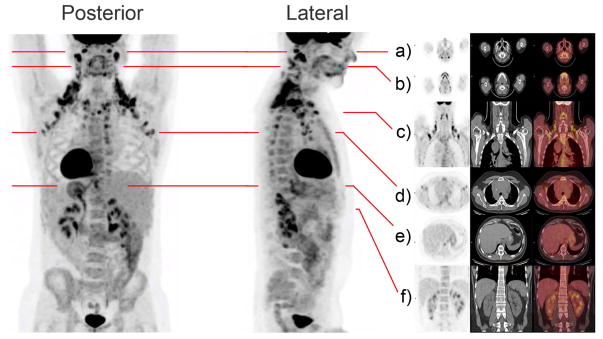
Figure 1. Regions of High Level Glucose Uptake in Humans as Assessed by 18F-FDG-PET/CT.
Metabolic activity in thermogenic tissues is demonstrated in this subject imaged with integrated [18F]-Fluorodeoxyglucose-Positron Emission Tomography–Computed Tomography (18F-FDG-PET/CT) at room temperature. Frontal and lateral maximal PET intensity projection images in an adult male subject show distribution of glucose uptake by its image tracer 18F-FDG. In this subject, prominent FDG retention is shown in the cervical, supraclavicular, axillary, intercostal, mediastinal, ventral spinal, and peri-renal areas. Paravertebral tissue is also activated. Fat pads are also illustrated in multi-level transaxial or coronal PET/CT images (a–f) are shown in the Supplemental Movie (Movie S1).

