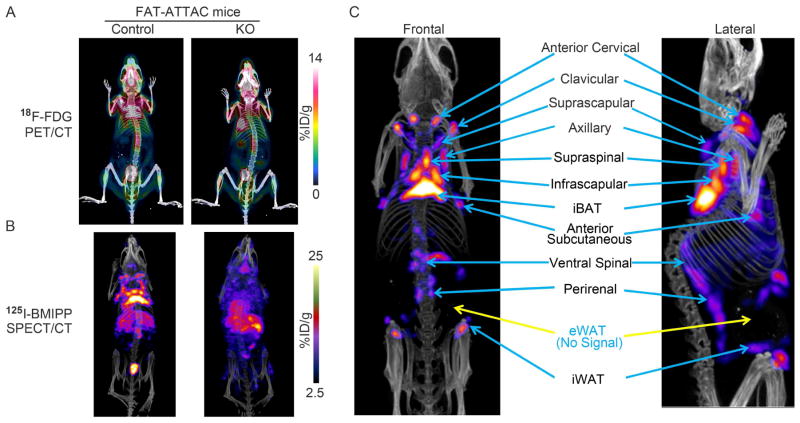
Figure 3. Signal intensity in a Lipodystrophic Rodent Model.
A. A model of inducible lipodystrophy (the “FAT-ATTAC mouse”) selectively loses adipocyte-derived signals upon 18F-FDG injection compared to control. B. SPECT/CT imaging of the FAT-ATTAC lipodystrophic mouse confirms the identity of signals as adipocyte-derived 125I-BMIPP uptake. C. The main metabolically active adipose tissues indicated with blue arrows in an adult mouse model stimulated by β3-adrenergic agonist for 7 days. Blue color label with yellow arrows indicate fat pads that display background signal levels of 18F-FDG-PET/CT and 123I-BMIPP-SPECT/CT. In each case, representative images for n=3 repeats are shown.

