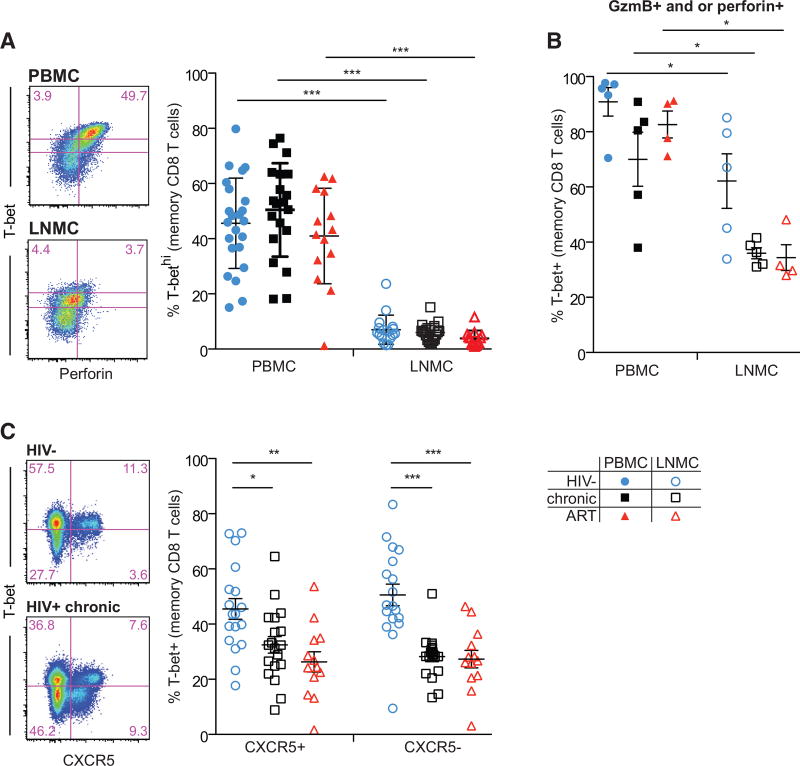
Figure 3. CD8+ T Cells Exhibit Dissociation between Transcriptional Drivers of Cytolytic Function and Expression of Cytolytic Proteins in LNs.
(A) Representative flow plots (left) showing memory CD8+ T cell expression of T-bet and perforin in PBMCs and LNMCs from an ART-treated HIV+ individual, and frequency of T-bethigh memory CD8+ T cells (right) in PBMCs and LNMCs. T-bet gating shown is the sum of the upper gates in the representative flow plots.
(B) T-bet frequency in memory CD8+ T cells expressing perforin and/or gzmB in PBMCs and LNMCs.
(C) Representative flow plots (left) showing memory CD8+ T cell expression of T-bet and CXCR5 in LNMCs from HIV− and HIV+ chronic, and T-bet frequency in CXCR5+ and CXCR5− CD8+ T cells (right) in LNMCs.
Statistical significance between subject groups within a tissue compartment was determined using the Kruskal-Wallis test with Dunn’s post-test. Statistical significance within a subject group between tissue compartments was determined using the Mann-Whitney two-tailed test. *p < 0.05; **p < 0.01; ***p < 0.001. Blue circle, open blue circle, HIV−; black square, open black square, HIV+ therapy-naive; red triangle, open red triangle, HIV+ on ART. Ranges shown on plots represent mean ± SEM.

