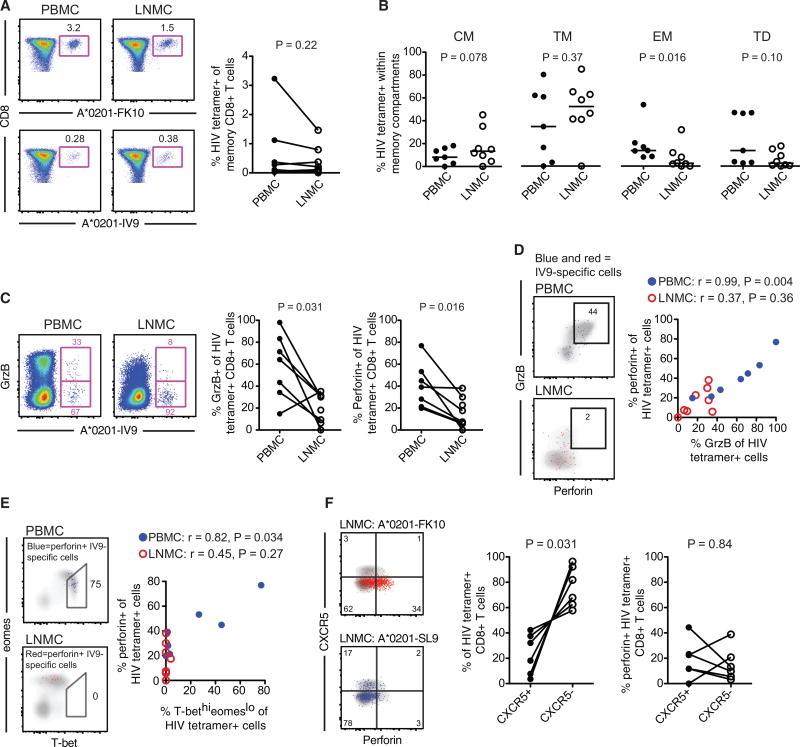
Figure 4. HIV-Specific CD8+ T Cells Are Poorly Cytolytic and Express Low Levels of T-Bet and CXCR5 in LNs.
(A) Flow plots (left) showing FLGKIWPSHK (FK10)/HLA-A*0201 and ILKEPVHGV (IV9)/HLA-A*0201 tetramer stains of PBMCs and LNMCs from the same subject, and frequency of matched HIV-tetramer+ CD8+ T cell responses (right) in PBMCs and LNMCs.
(B) Compartmentalization of HIV-tetramer+ CD8+ T cell responses within different memory subsets: central memory (CM; CCR7+ CD27+ CD45RO+), transitional memory (TM; CCR7− CD27+ CD45RO+), effector memory (EM; CCR7− CD27− CD45RO+), and terminally differentiated (TD; CCR7− CD27− CD45RO−).
(C) Flow cytometry plots (left) showing gzmB expression in HIV-tetramer+ CD8+ T cells in PBMCs and LNMCs from the same subject, and frequency of perforin and gzmB expression for all HIV-tetramer+ CD8+ T cells (right) in PBMCs and LNMCs.
(D) Frequency of perforin and gzmB co-expression in matched HIV-tetramer+ CD8+ T cells (left) in PBMCs (blue) and LNMCs (red), and correlation between perforin+ and gzmB+ HIV-tetramer+ CD8+ T cells (right) in PBMCs (blue) and LNMCs (red).
(E) Frequency of perforin+ HIV-tetramer+ CD8+ T cells within the T-bethigheomesdim population (left) in PBMCs (blue) and LNMCs (red), and correlation between perforin+ and HIV-tetramer+ CD8+ T cells (right) in PBMCs (blue) and LNMCs (red).
(F) Flow plots (left) showing HIV-tetramer+ CD8+ T cell expression of CXCR5 and perforin for two distinct specificities in LNMCs from the same subject, frequency of CXCR5+ versus CXCR5− HIV-tetramer+ CD8+T cells (middle) in LNMCs, and perforin expression in CXCR5+ and CXCR5− HIV-tetramer+ CD8+ T cells (right) in LNMCs. Flow plots are representative of chronically infected HIV+ individuals. Statistical significance within a subject group between tissue compartments was determined using the Mann-Whitney two-tailed test. Statistical significance for correlations was determined using Spearman’s test. Ranges shown on plots represent median and interquartile range (IQR).

