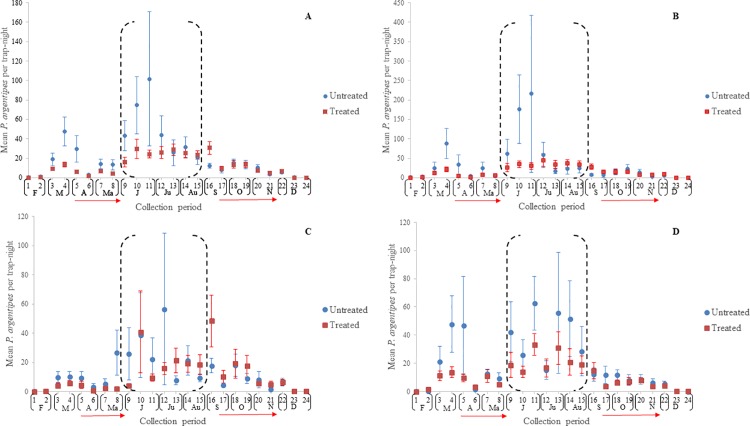
Fig 7.
Mean P. argentipes per trap-night in IRS-treated and untreated villages in Saran in a) pooled locations, b) cattle enclosures, c) houses, and d) vegetation. Vertical lines indicate the ±standard error (SE) and horizontal red arrows the range in 1st and 2nd round IRS spray dates. The black-dashed brackets (June-August) indicate the months of highest risk of human-vector exposure.

