
Fig 2.
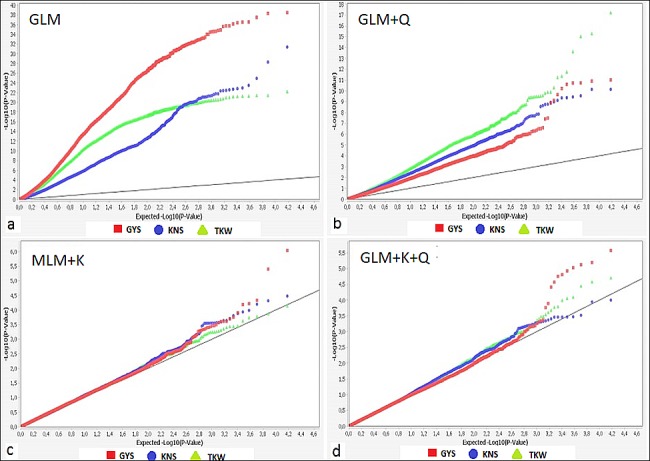
Quantile-quantile plots by four statistical GWAS models for yield component traits (mean values across seven environments): a) general linear model (GLM); b) GLM including the Q-matrix derived from the principal component analysis (GLM+Q); c) mixed linear model (MLM) based on the kinship-matrix (MLM+K); d) MLM based on both the K-matrix and the Q-matrix (MLM+K+Q). GYS = Grain yield per spike, KNS = Kernel number per spike, TKW = Thousand kernel weight.