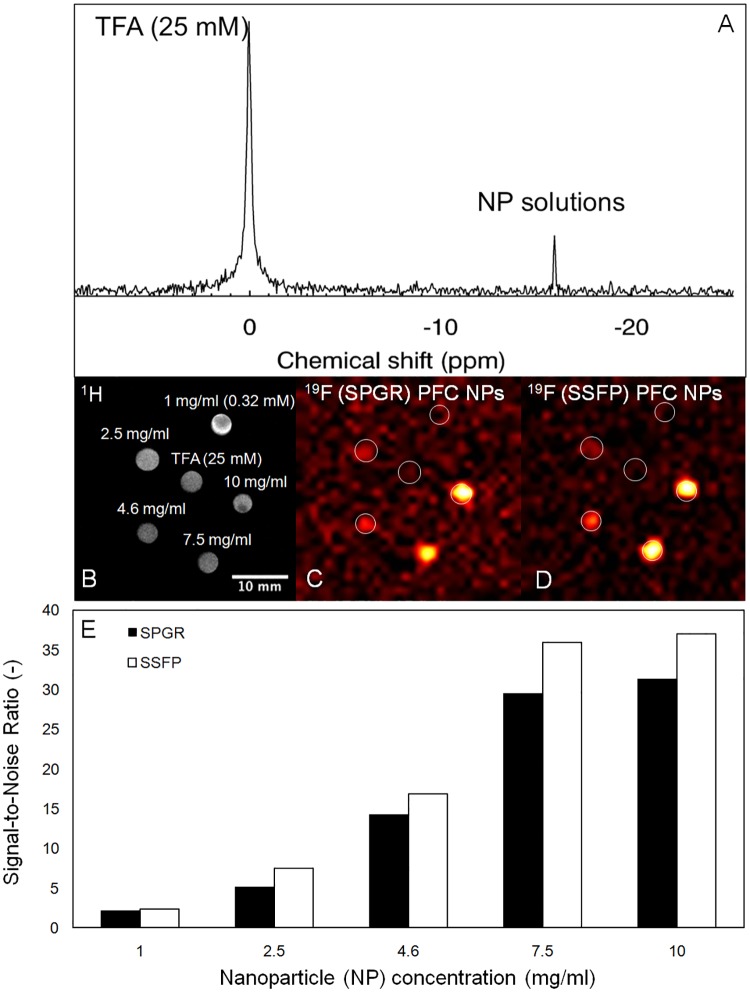
Fig 4. 19F MRI validation in NP solution phantoms.
(A) Non-selective 19F magnitude spectrum of NP solutions in the presence of a 25 mM TFA phantom (as shown in B). (B) 1H and 19F MRI of NP phantoms using (C) the SPGR, and (D) the echo-SSFP sequences. The TFA phantom does not appear in 19F MRI (C, D) since broadband excitation/narrowband receiver detection was used centered at the NP resonance. (E) Variation of the mean 19F SNR from phantom solutions in (C, D) above for the SPGR and SSFP sequences for different NP concentrations.

