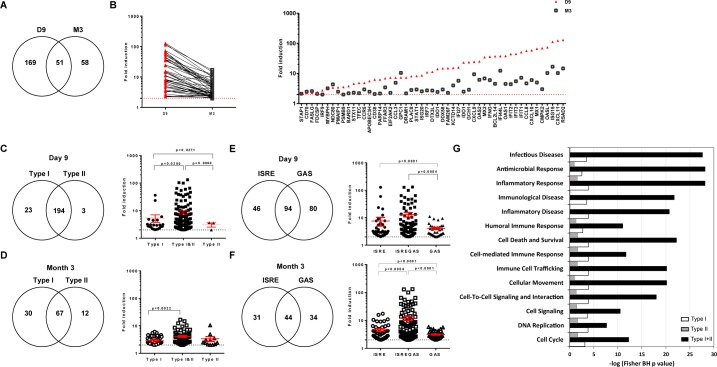
Fig 4. SIV infection induces ISG expression during both phases of infection in PLNs.
(A) Venn diagram showing the number of ISGs expressed at D9, M3, or both time points. (B) Comparison of mean ISG expression FC at D9 and M3 p.i. for the 51 ISGs expressed at both time points. (C) Venn diagram of ISGs expressed at D9 p.i., splitting them into those only inducible by type I IFN (Type I), only inducible by type II IFN (Type II), and those inducible by both IFN types (left) and comparison of their mean induction levels (right). (D) Venn diagram of ISGs expressed at M3 p.i., splitting them into those only inducible by type I IFN, those only inducible by type II IFN, and those inducible by both IFN types (left) and comparison of their induction levels (right). (E) Venn diagram of ISGs expressed at D9 p.i., splitting them into those displaying at least one ISRE, one GAS, or both sequence motifs in their promoters (left) and comparison of their induction levels (right). (F) Venn diagram of ISGs expressed at M3 p.i., splitting them into those displaying at least one ISRE, one GAS, or both in their promoters (left) and comparison of their induction levels (right). (G) Functional enrichment of type I-, type II-, and type I&II ISG subsets. The p value was calculated by the Fisher test with the Benjamini-Hochberg correction for multiple comparisons. The -log(p-value) is given for the most significant processes. In C, D, E, and F, the p value is given for Welch's unequal variances t-test, considering p < 0.05 to be significant.

