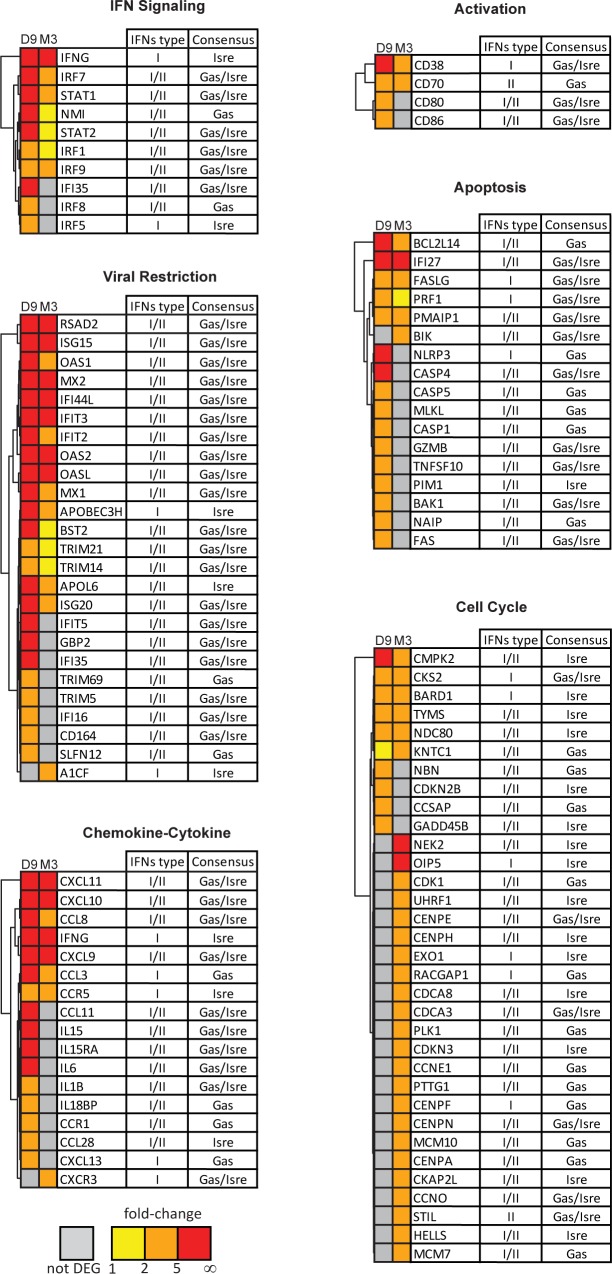
Fig 6. Heat-map signatures of differentially expressed ISGs.
The differentially expressed genes of the ISG cluster with the most significant functions are represented as heat-maps. The color intensity shown at each time point is related to the FC in RNA expression: grey for not differentially expressed (not DEG), yellow for FC values between 1 and 2, orange for FC values between 2 and 5, and red for FC values above 5.

