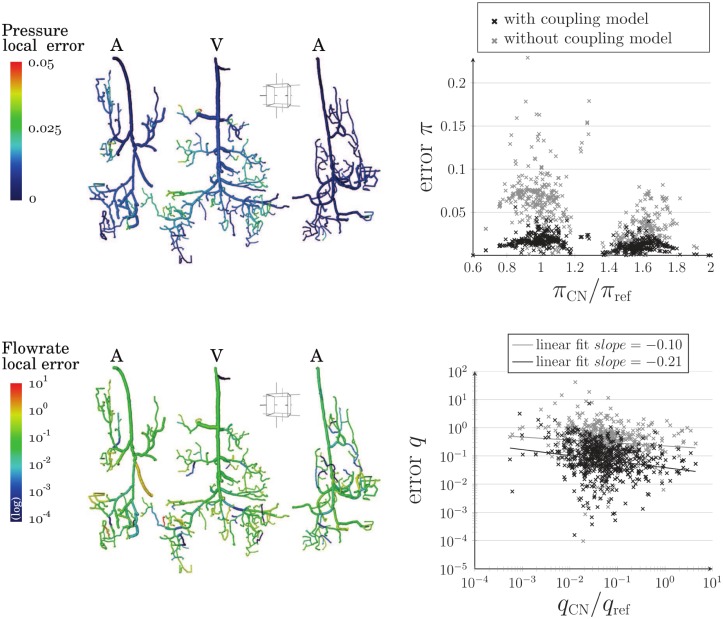
Fig 9. Distribution of pressure and flow rate local errors by comparing the hybrid and CN approaches in the large realistic configuration.
(a) Pressure and flow rate error maps in arteriolar and venular trees are presented. (b) In black crosses, local errors are plotted against local pressure or flow rate reference values. Additional errors are represented as gray crosses corresponding to computations without the proposed coupling model (pressure continuity at coupling sites). Here, πref = 5 000 Pa and qref = 5 × 10⁻¹² m3 · s−1 are reference pressure and flow rate values used for nondimensionalization.

