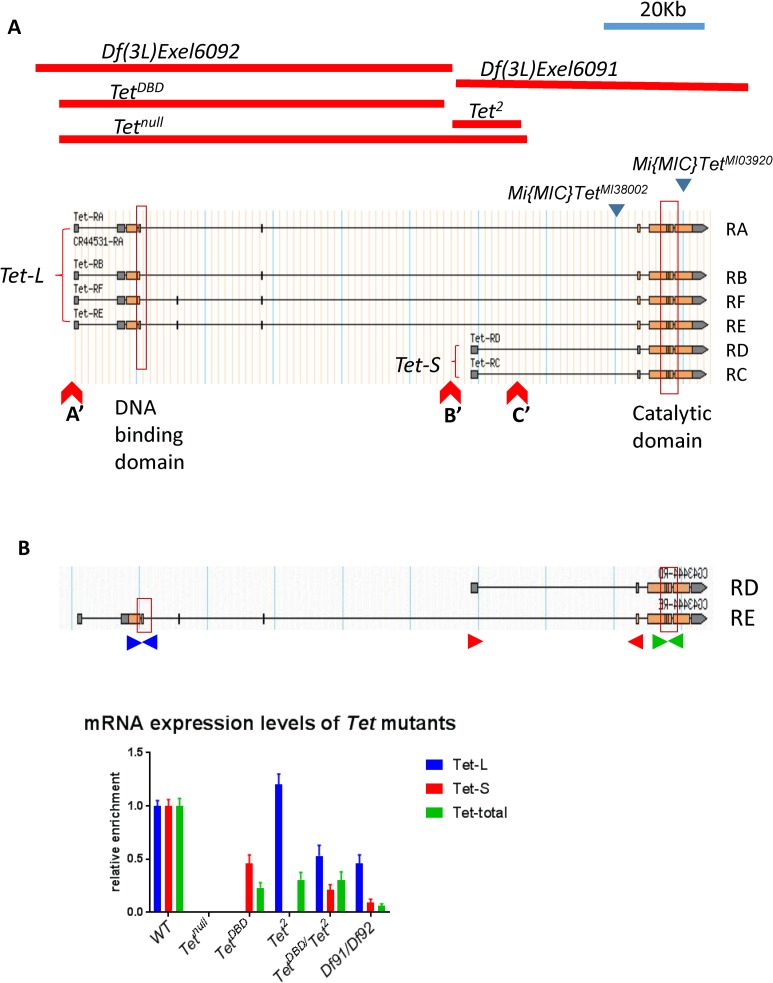
Fig 1. The Tet locus.
(A) The different Tet transcripts (Tet-L and Tet-S) and the location of the DNA-binding and catalytic domains (boxes), as well as the two Mi{MIC} insertions (blue triangles) are indicated. Red lines show the extent of the Tet deletions. Red Triangles mark insertion sites of the piggyback transposons used for induction of deletions. (B) The Tet-L and Tet-S transcripts and their expression levels in WT and Tet brains. Primer pairs specific to the long transcript (TetL, blue), the short transcript (TetS, red) and all transcripts (green) were used. Df91/Df92 = Df(3L)Exel6091/Df(3L)Exel609. qRT-PCR results are normalized to Rp49 (RpL32).

