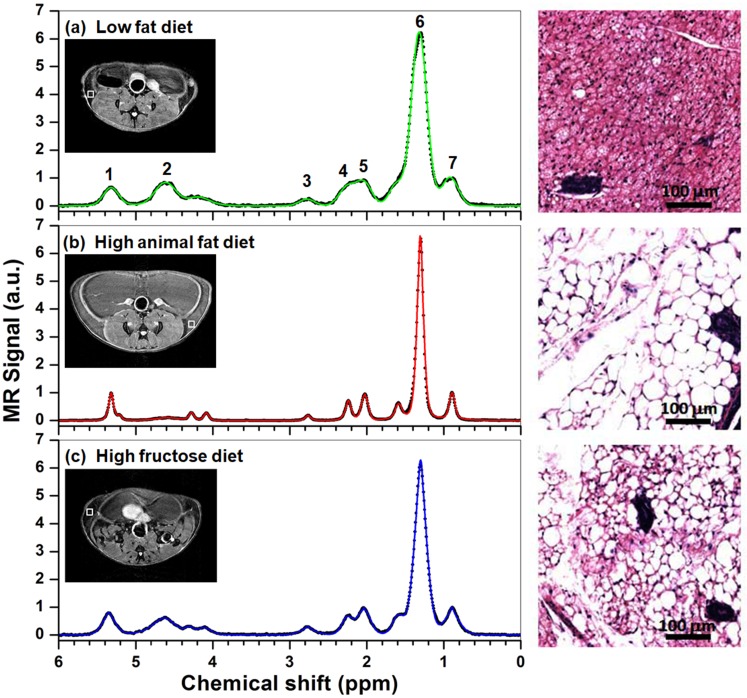
Fig 1. Plots of spectrum (black dots) measured from the LFD (top), HAFD (middle), and HFruD (bottom) fed SV40 mice, and corresponding fitted the spectrum (color lines) with a combination of Gaussian and Lorentz functions.
1: Olefin (−CH = CH−) at 5.4 ppm, 2: Water (H2O) at 4.65 ppm, 3: Diallyl (= CH−CH2−CH =) at 2.8 ppm, 4: α-Methylene to carboxyl at 2.3 ppm, 5: Allyl (−CH2−CH = CH−) at 2.1 ppm, 6: Methylene (−CH2−) at 1.3 ppm, 7: Methyl (−CH3) at 0.9 ppm. The locations of 1 mm3 ROIs (white squares) used for the PRESS pulse sequence are shown in the insets T2W images. The right panel shows examples of histological images from inguinal mammary glands.

