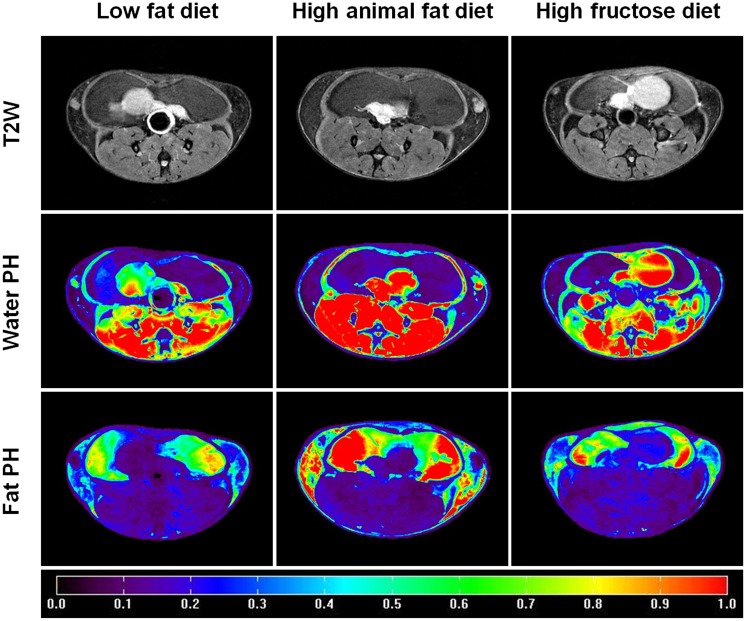
Fig 4. Example of T2W images (top row), water peak height (PH) images (maps) (middle row), and fat peak height (PH) images (maps) (bottom row) for LFD (left panel), HAFD (middle panel), and HFruD (right panel) fed SV40 mice.
The color bar indicates the normalized signal intensity values, which were obtained by dividing the average of water peak height intensity over the muscle ROI.

