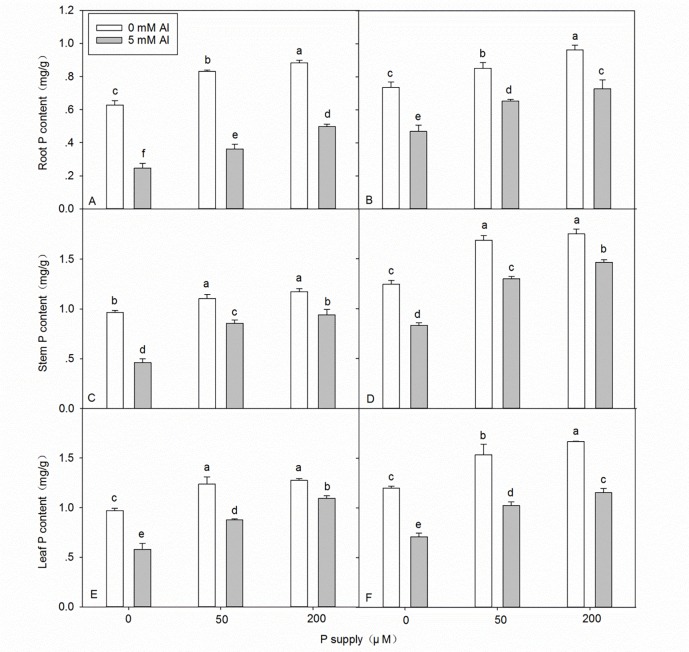
Fig 3.
Phosphorus (P) content in the root, stem, and leaf of DH32-29 (A, C, E) and G9 (B, D, F) seedlings subjected to different Al and P treatments. Bars represent means ± standard deviations (n = 3). Differences among the six treatments were analyzed using 2 (Al) × 3 (P) analysis of variance. Different letters above the bars indicate a significant difference at P < 0.05.

