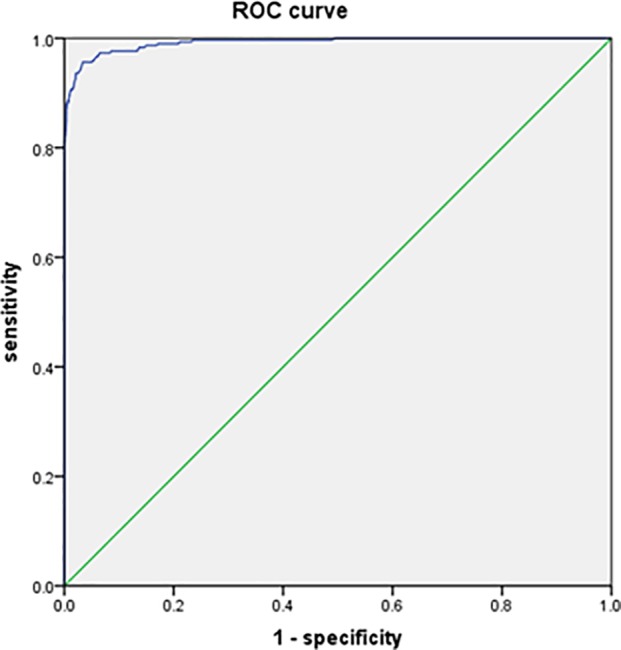
Fig 1. ROC curve of serum ceruloplasmin concentration for the diagnosis of WD.

The curve was constructed using the data of 297 patients with WD and 3751 non-WD patients. The area under the curve was 0.992 (95% confidence interval (CI), 0.987–0.996).

The curve was constructed using the data of 297 patients with WD and 3751 non-WD patients. The area under the curve was 0.992 (95% confidence interval (CI), 0.987–0.996).