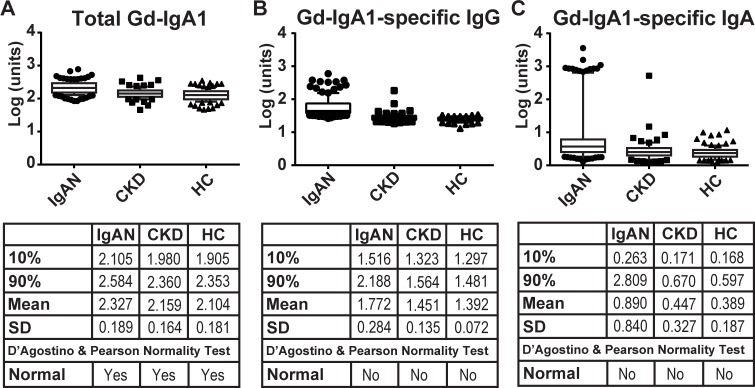
Fig 1. Analysis of total Gd-IgA1, Gd-IgA1-specific IgG, and Gd-IgA1-specific IgA in serum samples from patients with IgAN (IgAN), chronic-kidney disease controls (CKD), and healthy controls (HC).
Box and Whisker plots of 10-90th percentiles with additional points shown as circles (IgAN), squares (CKD), and triangles (HC). Group statistics, including the mean and standard deviation (SD) as well as the result of the D’Agostino & Pearson normality tests, are shown in the tables. Log transformation of each measurement is plotted in the corresponding units, as outlined in Methods.

