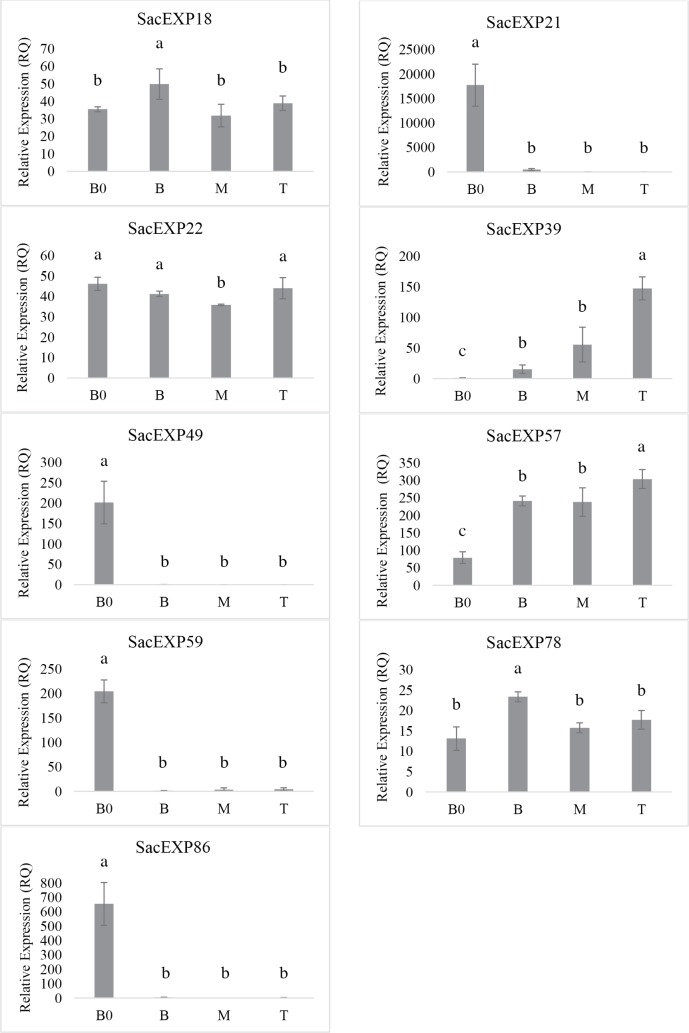
Fig 5. Expression profile of genes encoding expansins in segments of sugarcane leaf: Base "zero" (B0), Base (B), medium (M) and tip (T) determined by Mattielo et al. 2015.
Values represent mean± standard error of the mean (SEM, n = 3) for each segments of sugarcane leaf. Individual bars with different alphabets indicate statistical significance (p<0.05).

