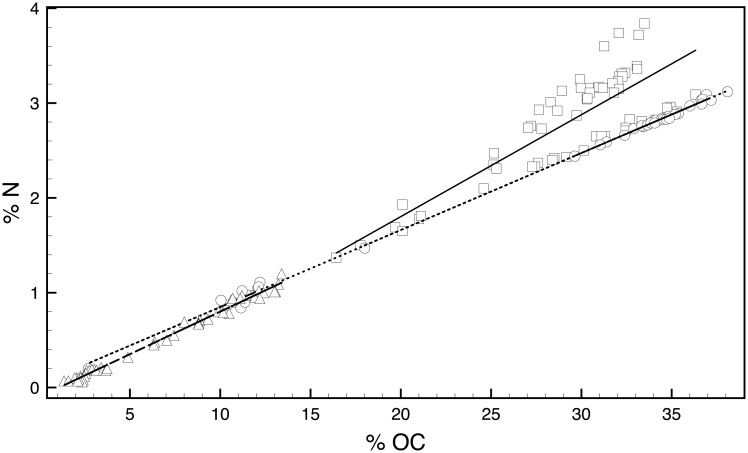
Fig 7. Plot of total organic carbon percent versus total nitrogen.
The plot is divided according to core zone: zone 1, squares with solid trend line (R2 = 0.72, b = -0.72), zone 2, circles with dashed trend line (R2 = 0.99, b = 0.03), and zone 3, triangles with dotted trend line (R2 = 0.99, b = -0.09). For all samples R2 = 0.95 and b = -0.09).

