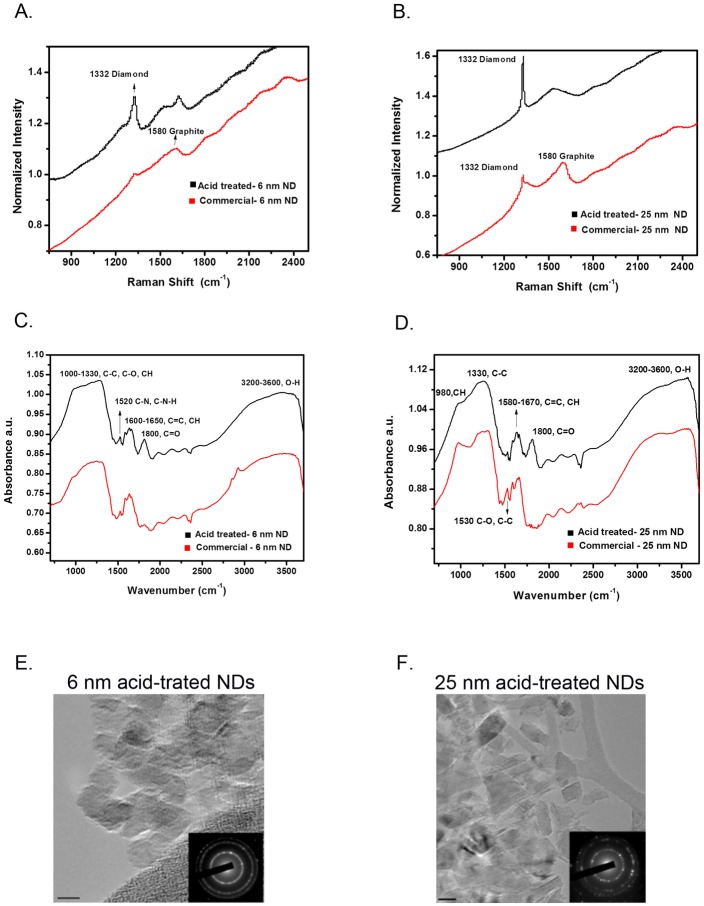
Fig 1. Purification and characterization of 6 nm and 25 nm nanodiamonds.
Raman spectra of 6 nm (A) and 25 nm (B) commercial (black line) and acid-treated NDs (red line). FTIR spectra of 6 nm (C) and 25 nm (D) commercial (black line) and acid-treated NDs (red line). (E) Transmission electron micrographs from 6 nm and 25 nm acid-treated NDs. The diffraction patterns of the NDs are depicted in the inset of each image. Scale bar for 6 nm acid-treated NDs = 5 nm and scale bar for 25 nm acid-treated NDs = 20 nm.

