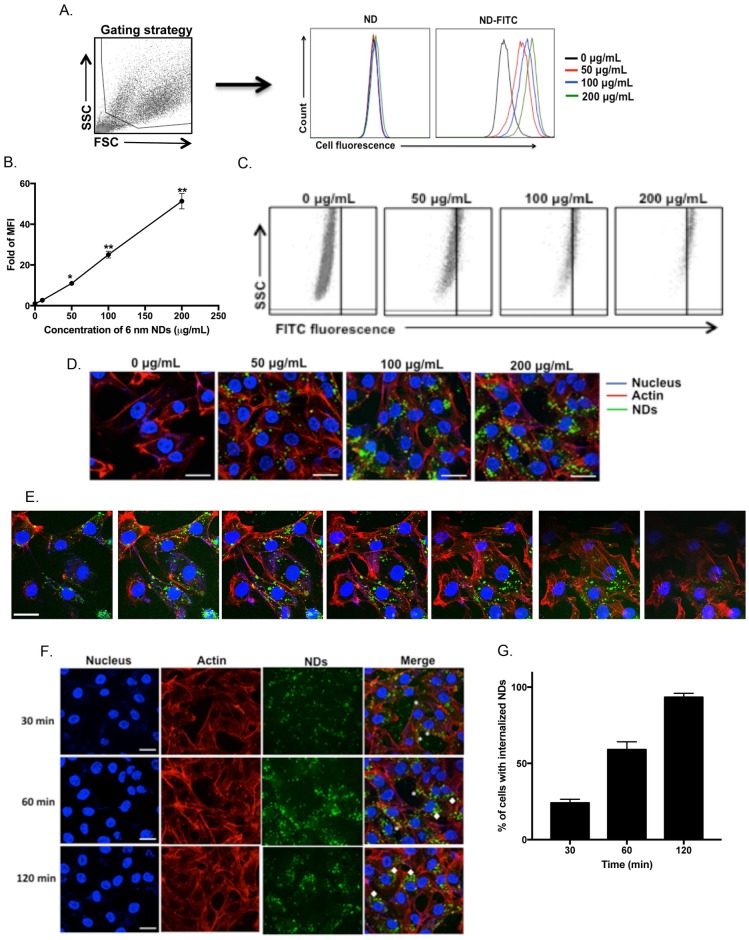
Fig 4. Acid-treated 6 nm NDs are internalized in T24 cell by 2 hours.
T24 cells were treated different concentrations of 6 nm acid-treated FITC labeled of unlabeled NDs for 1 hour. The cells were washed and analyzed by flow cytometry. The gated cells were evaluated for FITC fluorescence and the overlayed histograms (A) are depicted. The experiment was performed at least three independent times in duplicates. The result of one representative experiment is depicted. (B) The mean fluorescence intensity (MFI) for samples treated with FITC-labeled NDs was evaluated. The MFI of the untreated sample (μg/mL) was considered 1 and the MFI for all other samples were normalized to the untreated sample and plotted as mean ± SEM. Data are representative of at least three independent experiments. *P<0.01, **P<0.0001 was determined by one-way ANOVA followed by Tukey’s multiple comparisons test. (C) Scatter plots of Side scatter (SSC) vs FITC fluorescence of gated cells are depicted. The experiment was performed at least three independent times in duplicates. The result of one representative experiment is depicted. (D-G) T24 bladder cells were treated with different concentrations of FITC labeled 6 nm NDs for 1 hour (D-E) or with 100 μg/mL for different periods of time (F). The cells were fixed and permeabilized. The nuclei of the cells were stained with DAPI and actin filaments were stained with phalloidin conjugated to Alexa fluor 660. The cells were then observed by confocal microscopy. The experiment was performed at least three independent times and the result of one representative experiment is depicted. To determine the internalization of NDs in T24 bladder cells (E), z-stack analysis was performed and a few representative stacks of one image are shown. For the kinetic analysis (F), T24 bladder cells were treated with 100 μg/mLof FITC-labeled 6nm NDs for different periods of time. Z-stack analysis was performed and one representative image from the middle of the stack is depicted below. NDs associated with the cell membrane (*) or internalized in the cells (◆) are shown. Scale bar = 25 μm. The % of cells with NDs internalized was plotted (G) as mean ± SEM.

