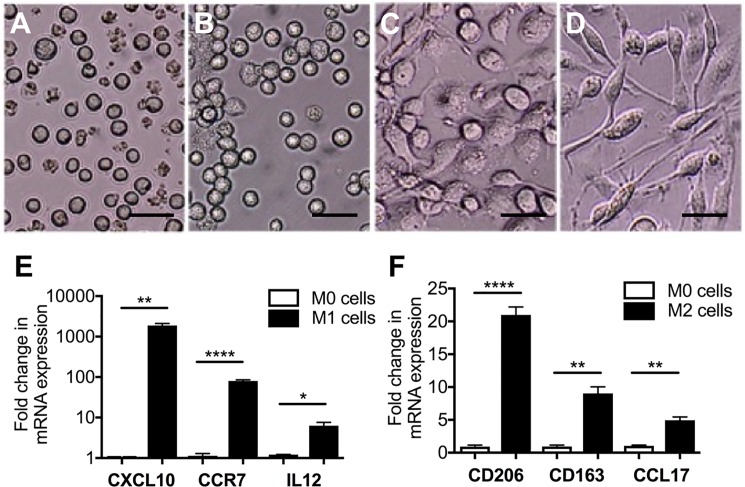
Fig 2. THP1 cells differentiated into polarized macrophages display characteristic morphology and markers of polarization.
A-D, photomicrographs showing characteristic morphologies of THP1 cells (A), and differentiated M0 (B), M1 (C), and M2 (D) macrophages. M1 macrophages (C) appear flattened as compared with M0 cells (B), and M2 macrophages take on a more elongated shape (D). E-F, qPCR quantification of M1 (E) and M2 (F) macrophage markers in THP1-derived M1 and M2 cells, respectively, relative to M0 cells. The expression of M1 and M2 mRNA markers is consistent with the observed morphologies of the M1 (C) and M2 (D) macrophages. Graphs represent means ± standard error. Scale bar = 30 μm; * = p < 0.05, ** = p <0.01, and **** = p <0.0001.

