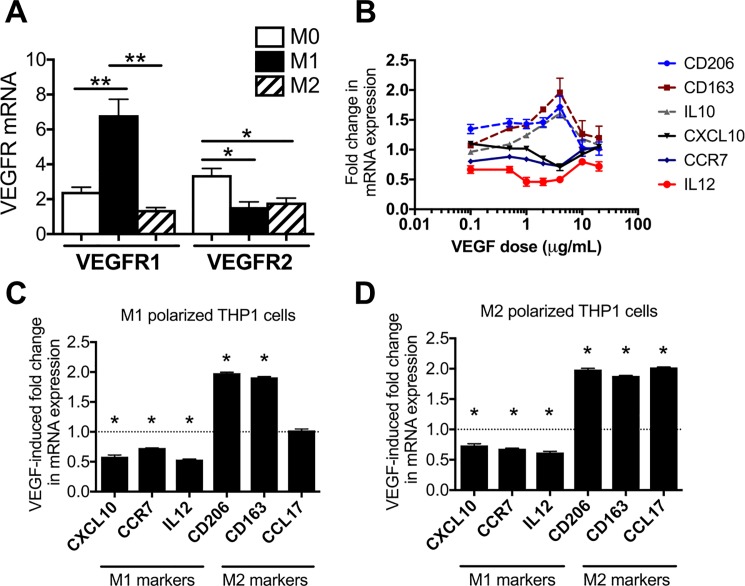
Fig 3. VEGF treatment suppresses M1 markers and induces M2 markers in polarized macrophages.
A, qPCR analysis of M0, M1, and M2 cells shows that all three express both VEGF receptors 1 (VEGFR1) and 2 (VEGFR2). Note the highly significant increase in expression of VEGFR1 in M1 cells. B, initial dose-response study showing the effect of increasing concentrations of rhVEGF (0.1–20 μg/mL). VEGF induces an upregulation of M2 markers and downregulation of M1 markers in THP1-derived M1 cells, with highest response seen at 4 μg/mL. C-D, VEGF treatment at 4 μg/mL caused an increase in M2 markers and a decrease in M1 markers in both THP1-derived M1 (C) and M2 (D) macrophages. Graphs represent means ± standard errors; * = p < 0.05, ** = p <0.01.

