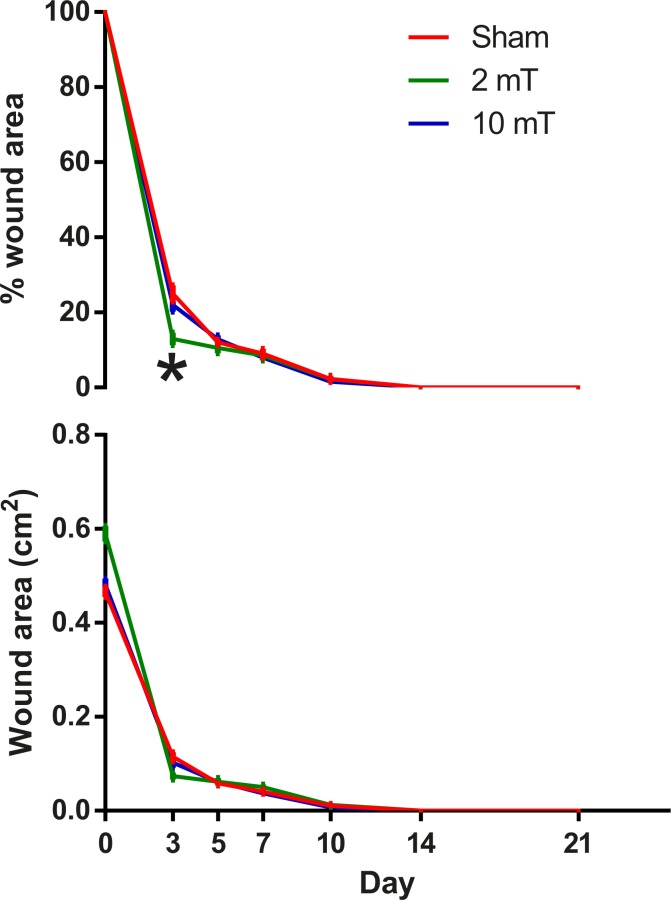
Fig 2. Wound area and percentage wound area measured from sham, 2-mT and 10-mT PEMF groups on post-wounding day 0, 3, 5, 7, 10, 14 and 21.
Data are expressed as mean ± s.e.m. The % wound area of the 2-mT PEMF group was significantly smaller than that of the sham PEMF group (p = 0.036). * p < 0.05. The data used to plot this figure can be found in S1 Data.

