
Fig 2.
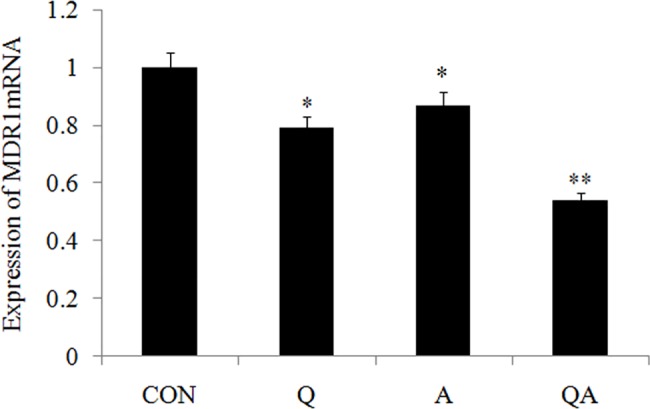
(a-c) RT-PCR was performed to examine the effect of Q, A and QA on the mRNA expression of MDR1. GAPDH served as an internal control. Data are presented with mean±standard deviation (n = 5) *p<0.05, compared with the control group; *p<0.01, compared with the control group.