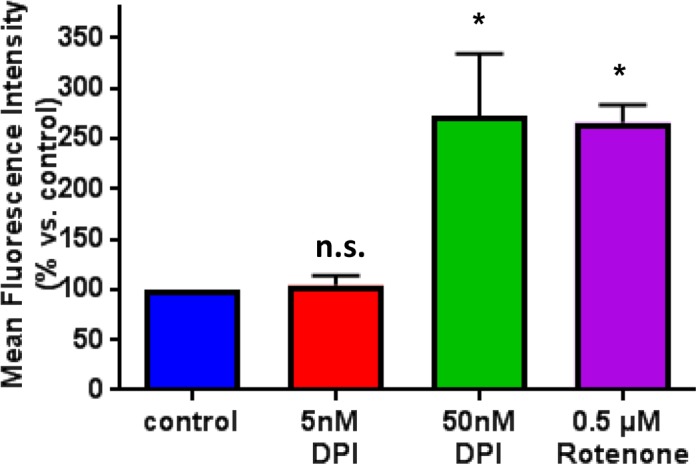
Figure 9. Effect of DPI treatment on mitochondrial ROS production.

The effects of DPI on mitochondrial ROS production were determined over the range of 5 to 50 nM. Note that at a concentration of 5 nM, DPI failed to induce mitochondrial ROS production. In contrast, 50 nM DPI induced the same amount of mitochondrial ROS as 500 nM Rotenone, which was used as a positive control. Mitochondrial ROS production was monitored by FACS analysis, using MitoSOX as a fluorescent indicator. * p<0.05.
