
Fig 4. The inter-individual variability of the immune response to a strain vs the intra-individual variability of the immune response to various strains within a species.
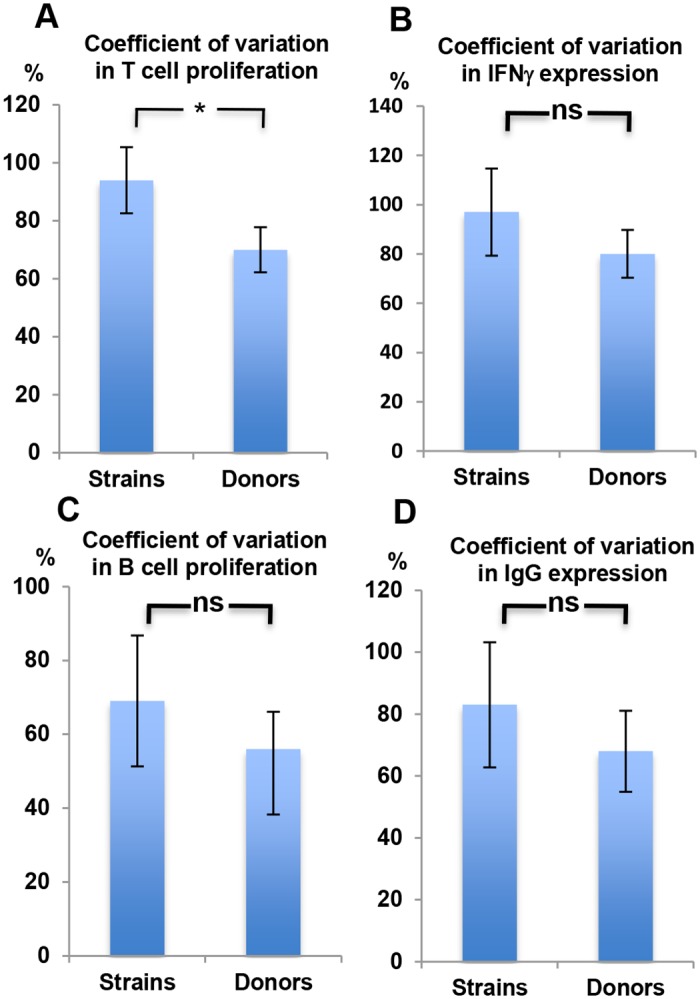
A, B, C, and D. The percentage Coefficient of Variation (CV) in % CD3+CD4+ proliferation (A), %IFNγ expressing CD4+ cells (B), % B cell Proliferation (C), and % IgG expression by proliferating B cells (D), was calculated across bacterial strains vs donors. Expressed is the mean percentage CV±2*SEM.