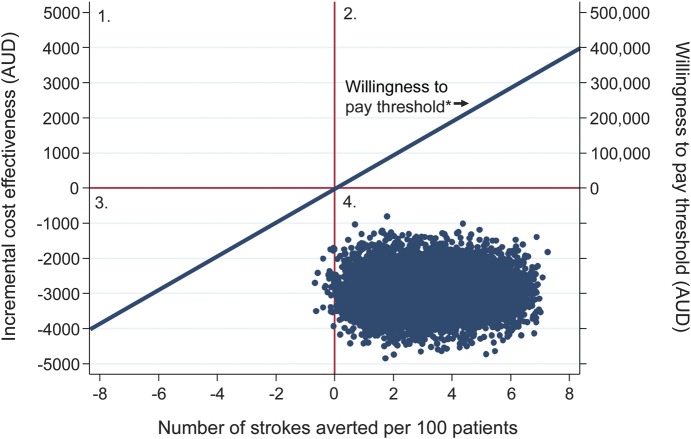
Cost-effectiveness scatterplot of M3T compared with the previous model
Figure. The cost-effectiveness scatterplot is presented using Monte Carlo simulation over 10,000 iterations. Location of the plotted points is interpreted as follows with regard to the new model (Monash TIA Triaging Treatment [M3T]): (1) (northeast quadrant)—more effective, more expensive; (2) (northwest quadrant)—less effective, more expensive; (3) (southwest quadrant)—less effective, more expensive; (4) (southeast quadrant)—more effective, less expensive (cost-saving). * The blue diagonal line indicates the willingness-to-pay threshold of AUD 50,000 per strokes averted. Points falling below the line are considered cost-effective.

