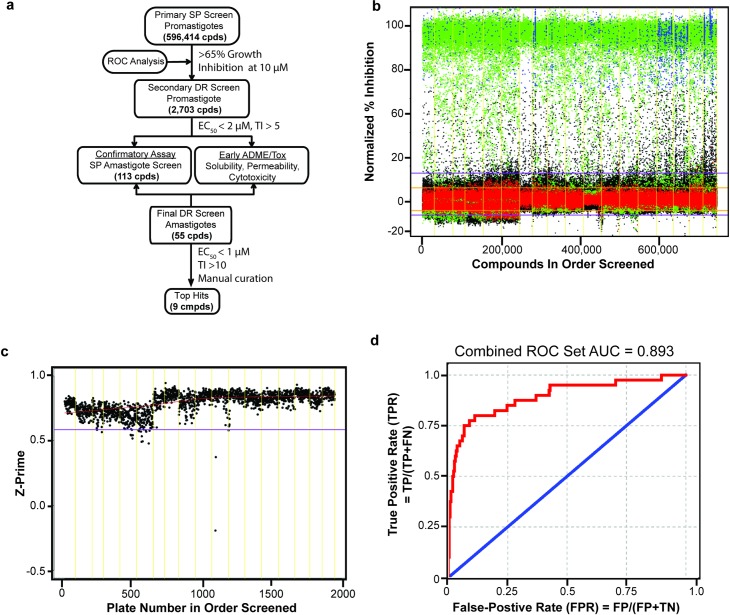
Fig 1. Screening flow chart and high throughput primary screen of promastigotes.
a. Schematic of the high-throughput screening workflow. SP refers to single point, or single concentration, and DR represents dose-response. The cutoff value of 65% inhibition in the first step was chosen based in ROC analysis, the cutoff of 2 μM and TI > 5 in step 2 was somewhat arbitrary but produced a reasonable number of hits for subsequent analysis, and the cutoff of 1 μM and TI > 10 for the final step is consistent with recommendations for lead identification for leishmaniasis [12]. b. Scatter plot of primary screen data shown as normalized percent growth inhibition. Each dot represents the activity of one compound. Negative controls (DMSO treated) are in red, positive controls (pentamidine treated) are in green, test compounds are in blue (hits) or black (non-hits). The orange and purple horizontal lines indicate the 95% and 99% quantiles of activity respectively. c. Primary screen quality control: Z-prime value per assay plate screened, lower outlier bound (in purple), yellow lines separate screen runs. d. Receiver operating characteristic (ROC) curve (red); the combined ROC set AUC is 0.893. The blue line represents an AUC of 0.5 that is indicative of an assay with random results. TP is true positive, FP is false positive, FN is false negative, and TN is true negative.

