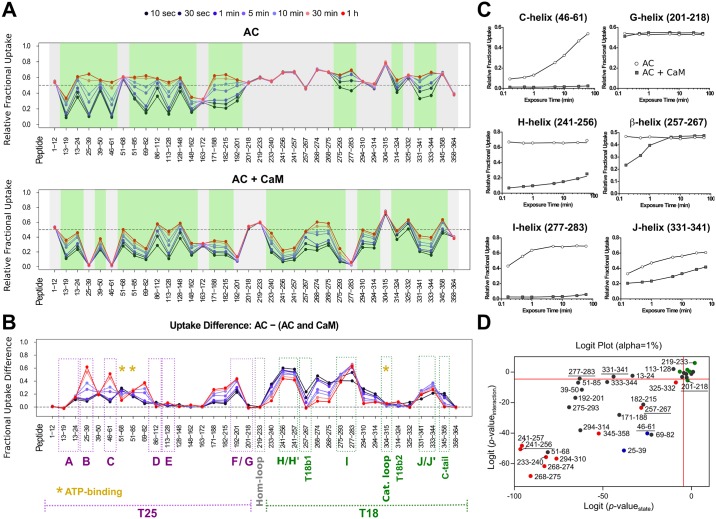
Fig 2. AC dynamics are significantly altered upon CaM interaction.
HDX-MS was performed at the peptide level to improve the spatial resolution. Panel (A) displays relative fractional uptake maps of AC alone and upon CaM binding. The presence of dynamic HDX-MS indicative of structure formation is colored green, whereas non-dynamic events are colored gray. CaM binding to AC results in an overall reduction in the solvent accessibility and structure formation in several regions. (B) Multiple regions of AC are altered upon CaM binding, as determined by the uptake difference chart. Major modifications of the AC T25 region are observed within helices B, C, and F. For the T18 region, primary sites of alteration are found within the H/H″-, I-, and J/J′-helices as well as within the T18b1 and C-tail regions of the protein. No changes in accessibility were observed at the Hom- and catalytic loops in either state. Sites of ATP-binding are also given. (C) Several types of HDX-MS behavior were observed upon AC:CaM complex formation. All AC peptides selected for final HDX-MS analysis are displayed in S10 Fig. (D) Logit representation of the statistical results generated for each peptide by MEMHDX. Peptides colored red display nondynamic behavior in the AC alone state only, while those in blue give nondynamic behavior in the AC + CaM state only. Green peptides are those that have nondynamic HDX-MS behavior in both states, while those peptides colored black are dynamic in both states. The FDR value was set to 0.01 (red lines). The data used to generate the figure can be found in S1 Data. AC, adenylate cyclase catalytic domain; CaM, calmodulin; FDR, false discovery rate; MEMHDX, Mixed-Effects Model for HDX experiments; T18, C-terminal trypsin-cleavage fragment of CyaA (amino acids 225–364); T25, N-terminal trypsin-cleavage fragment of CyaA (amino acids 1–224); T18b1, first beta-sheet of the T18 fragment.

