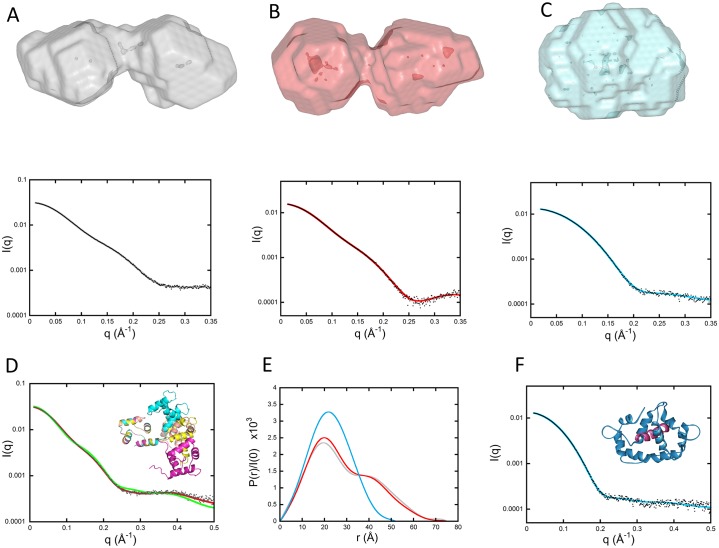
Fig 3. SAXS envelopes of CaM alone and in the presence of H-helix and PMLCK peptides.
(A, B, and C [top panels]) DAMMIN models of CaM alone, CaM:H-helix, and CaM:PMLCK complexes, respectively. (A, B, and C [bottom panels]) Corresponding fits (color curves) to experimental data (black dots). (D) Green curve: comparison of experimental data (black dots) to the scattering pattern of the crystal structure of CaM (pdb 1CLL) calculated using Crysol. Red curve: fit obtained using the program EOM and corresponding to the ensemble of four conformations shown in the inset after superimposition of the N-terminal domain of each conformation. (E) Comparison of the three distance distribution functions obtained using the program GNOM for CaM alone (grey), CaM:H-helix (red), and CaM-PMLCK (cyan) complexes. (F) Comparison of experimental data (black dots) to the scattering pattern of the crystal structure of CaM: PMLCK (pdb 2K0F shown in the inset) calculated using Crysol (blue line). The PMLCK peptide is shown in purple. CaM, calmodulin; EOM, Ensemble Optimization Method; pdb, Protein Data Bank; PMLCK, myosin light-chain kinase peptide; SAXS, small-angle X-ray scattering.

