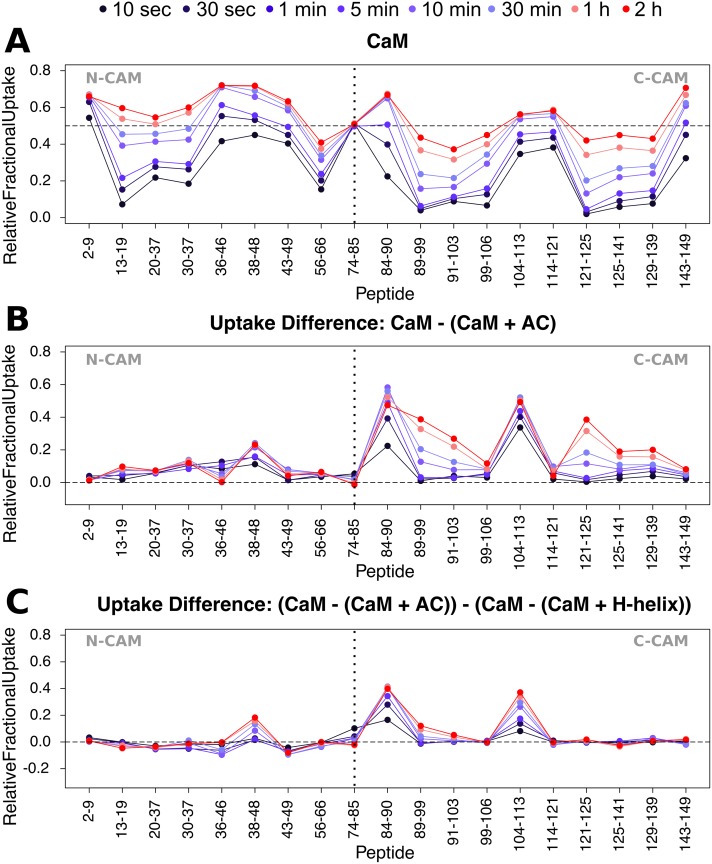
Fig 4. Differential HDX-MS patterns within CaM upon H-helix and AC binding.
(A) Relative fractional exchange data were calculated at each point and plotted as a function of peptide position for full-length CaM. (B) Uptake difference plot for CaM in the presence of AC. AC-induced differences in deuterium exchange are principally located in C-CaM. (C) Uptake “difference of uptake differences” plot of CaM in the presence of AC and H-helix peptide. Addition of the full-length catalytic domain results in much greater differences in the deuteration of both N- and C-CaM compared to the H-helix region alone, e.g., in peptides 84–90 and 104–113. Uptake plots of all CaM peptides selected for final HDX-MS analysis are given in S11 Fig. The data used to generate the figure can be found in S3 and S4 Data. AC, adenylate cyclase catalytic domain; C-CaM, C-terminal domain of CaM; CaM, calmodulin; HDX-MS, hydrogen/deuterium exchange mass spectrometry; N-CaM, N-terminal domain of CaM.

