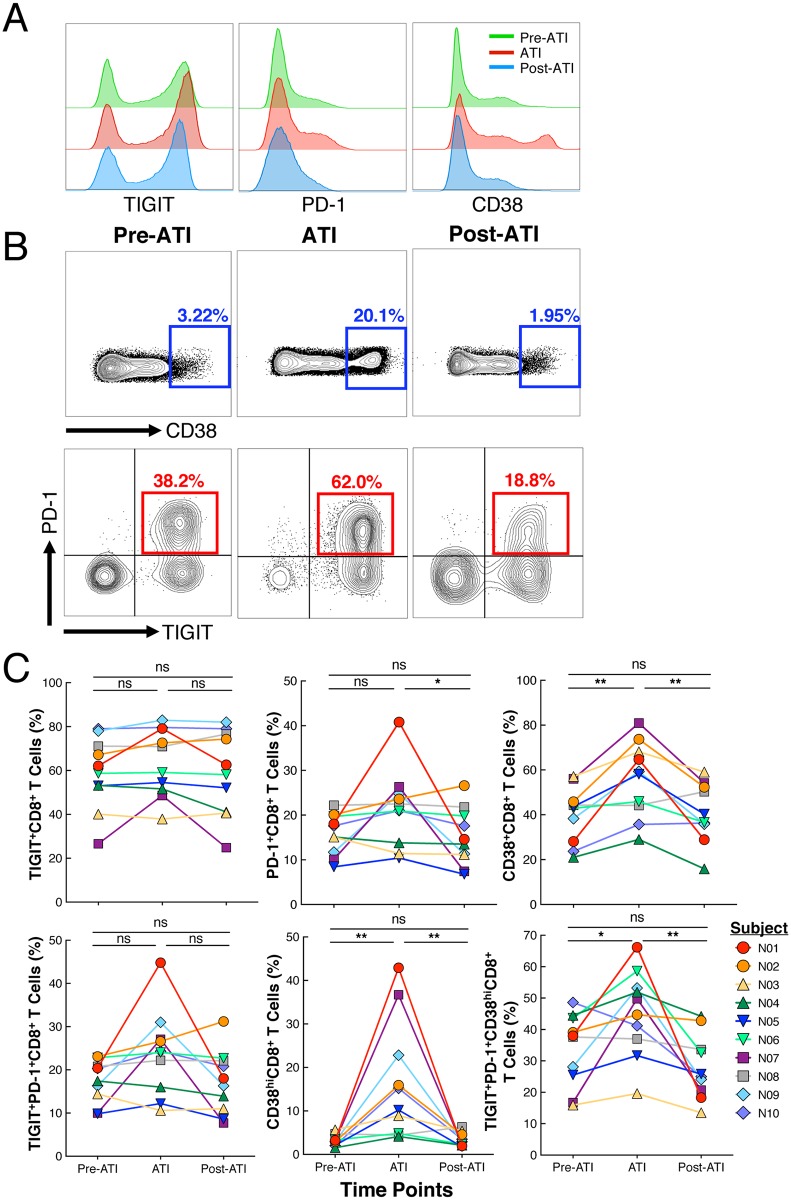
Fig 4. Longitudinal changes in exhaustion and activation parameters.
(A) Longitudinal changes in expression of TIGIT, PD-1, and CD38 on CD8+ T cells in a representative patient at the pre-ATI, ATI, and post-ATI time points. (B) FACS plots showing the gating strategy on the CD38hiCD8+ T cells at the pre-ATI, ATI, and post-ATI time points. The emergence of the CD38hi population during the ATI phase is exhibited in the first row. The second row demonstrates the increase in the PD-1/TIGIT double positive population within the CD38hi CD8+ T cells during ATI followed by a subsequent decrease after reinitiation of ART. (C) Summary of TIGIT, PD-1, and CD38 expression on CD8+ T cells as well within the CD38hiCD8+ T cell subset at pre-ATI, ATI, and post-ATI time points in the first and second row, respectively, for all ten patients included in the study. Statistical significance was tested with Wilcoxon’s signed rank test. *P < 0.05, **P < 0.01, ns, not significant.

