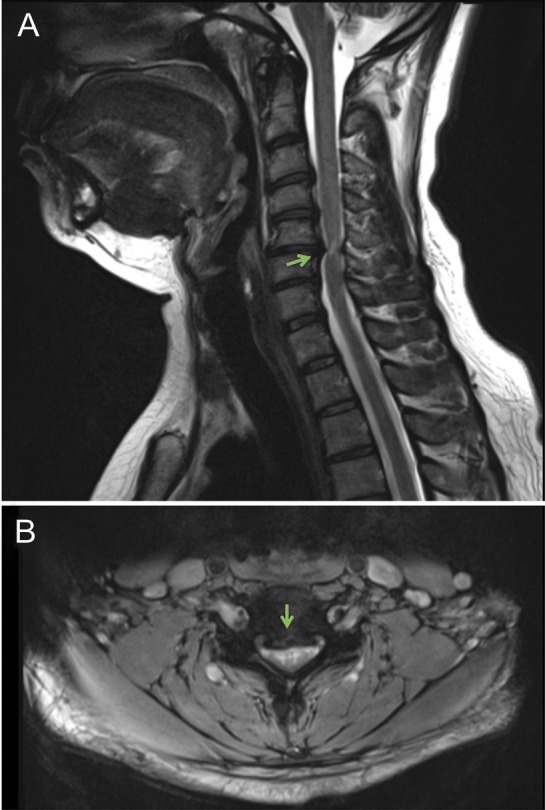
MRI of the cervical spine
Figure. T2-weighted MRI of the cervical spine in a sagittal view (A) illustrates herniated disks at C3-C4, C4-C5, and C5-C6 as well as an osteophytic spur at C5-C6 with spinal cord compression. T2-weighted imaging in an axial view (B) at C5-C6 shows the level of maximum compression. At the level of maximum compression, C5-C6, a hyperintensity signal (arrow), is illustrated.
