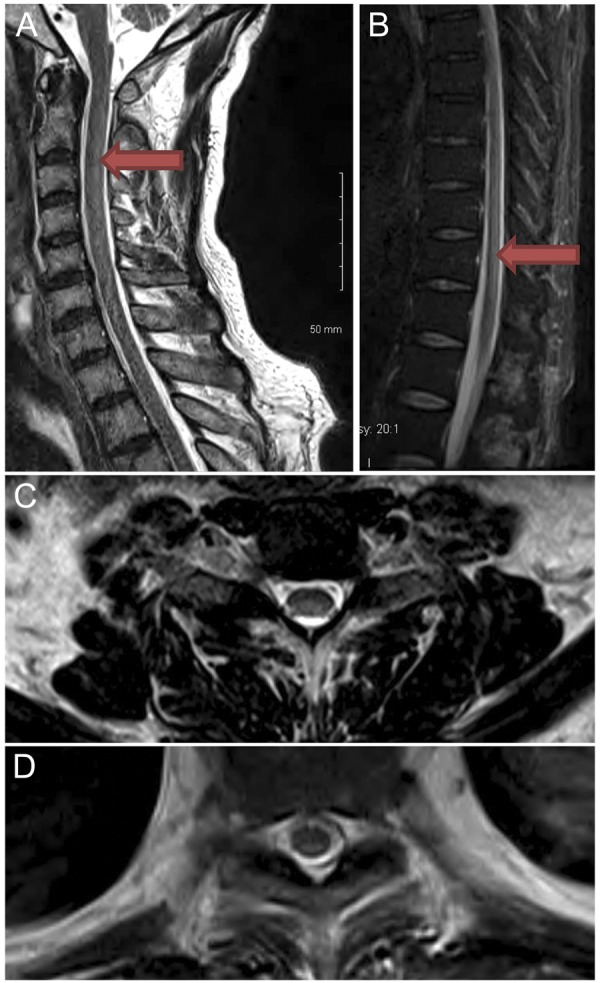
Abnormal signal in the cervical and thoracic spine
Figure 1. T2-weighted sagittal image of cervical (A) and thoracic (B) spine demonstrates subtle hyperintensity posteriorly, C2–C7, and T9 through conus. Axial T2 image at C5–C6 (C) and T9 (D) demonstrates hyperintensity dorsally.
