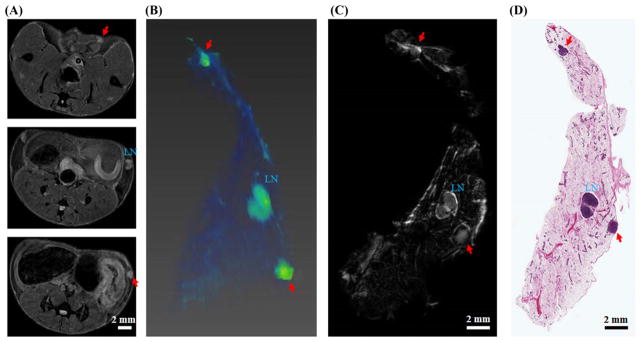
FIGURE 4.
Correlation of in vivo MR, ex vivo MR, and histological images of a 12-week-old SV40TAg mouse fed with HAFD. A, Three in vivo axial MR images; B, in vivo 3D volume-rendered image—only the right mammary gland is shown here. C, D, Comparison of an ex vivo MR image with an H&E image—in each case a central slice from the ex vivo MR and H&E images of the excised mammary gland is shown. The lymph node (LN) is labeled in each image; invasive cancers are indicated by two red arrows in in vivo MR, ex vivo MR, and H&E images

