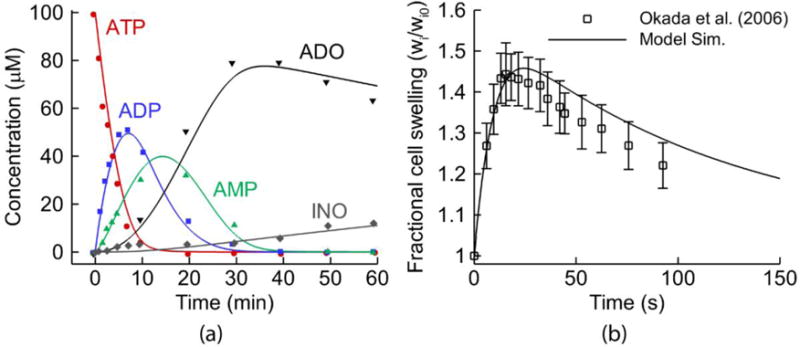
FIGURE 2.

Models Combined into the Integrative Model: (a) The extracellular purinergic metabolism model describing the time response of 100 μM [ATP] addition to human airway surfaces. As in Zuo et al. (2008), the symbols are experimental data, while the solid lines are the reproduced result by the ATP model component in the integrative cell model. (b) The reproduced result of the fluid transport model from Warren et al. (2010): the predictions of 33% hypotonic challenge experimental data from Okada et al. (2006)
