
Figure 1. Monocle 2 discovers a cryptic alternative outcome in myoblast differentiation.
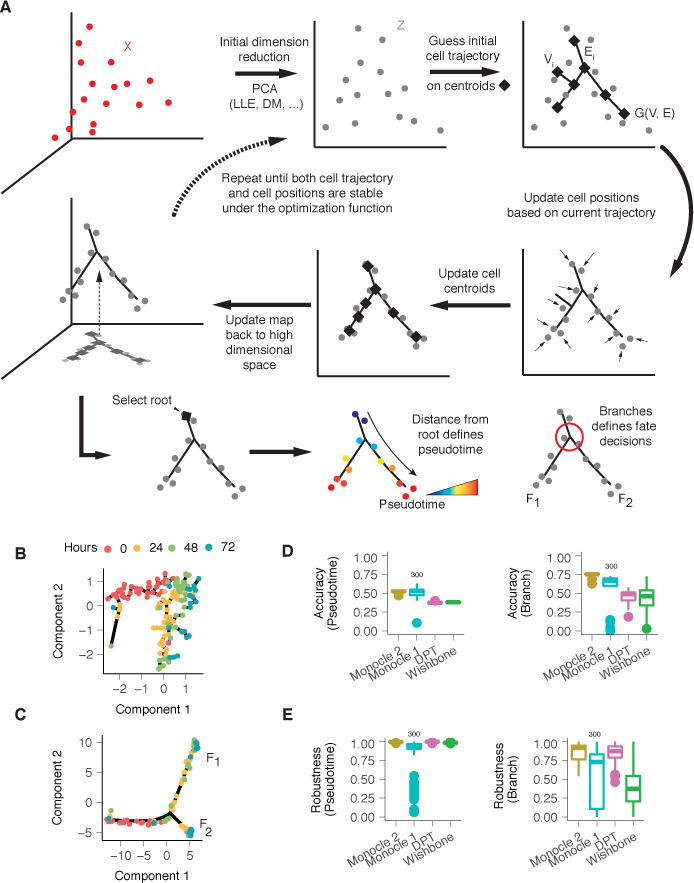
(A) Monocle 2 learns single-cell trajectories by reversed graph embedding. Each cell can be represented as a point in a high-dimensional space where each dimension corresponds to the expression level of an ordering gene. The high dimensional data are first projected to a lower dimensional space (Z) by any of several dimension reduction methods such as PCA (default), diffusion maps, etc. Monocle 2 then constructs a spanning tree on an automatically selected set of centroids of the data. The number of centroids (black diamonds) is determined using a formula that scales sublinearly in the number of cells. These centroids are chosen automatically using k-medoids clustering in the initialized low-dimensional space. The algorithm then moves the cells towards their nearest vertex of the tree, updates the positions of the vertices to “fit” the cells, learns a new spanning tree, and iteratively continues this process until the tree and the positions of the cells have converged (see Equation 3 in Methods). Throughout this process, Monocle 2 maintains an invertible map between the high-dimensional space and the low-dimensional one, thus both learning the trajectory and reducing the dimensionality of the data. In effect, the algorithm acts as soft K-means clustering on points Z that maps them to the centroids, and jointly learns a graph on the centroids. Once Monocle 2 learns the tree, the user selects a tip as the “root”. Each cell’s pseudotime is calculated as its geodesic distance along the tree to the root, and its branch is automatically assigned based on the principal graph. (B) Monocle 1 reconstructs a linear trajectory for differentiating human skeletal myoblasts (HSMM)1. (C) Monocle 2 automatically learns the underlying trajectory and detects that cells from 24–72 hours are divided into two branches. The same genes selected with dpFeature (Supplementary Figure 1; Methods) were used for ordering for both of Monocle 1 and Monocle 2. (D) Accuracy of pseudotime calculation or branch assignments from each algorithm under repeated subsamples of 80% of the cells on the Paul dataset9. A marker based ordering (see Methods) is used as ground truth for results from each software in all downsamplings to compare with. (E) Consistency of pseudotime calculation or branch assignments from each algorithm under repeated subsamples of 80% of the cells on the Paul dataset9. All pairwise downsamplings are used to calculate the Pearson’s Rho and adjusted Rand index (ARI). Monocle 2, DPT, and Wishbone all use the full dataset for benchmark while Monocle 1 only uses a random downsampled 300 cells as for benchmarking.