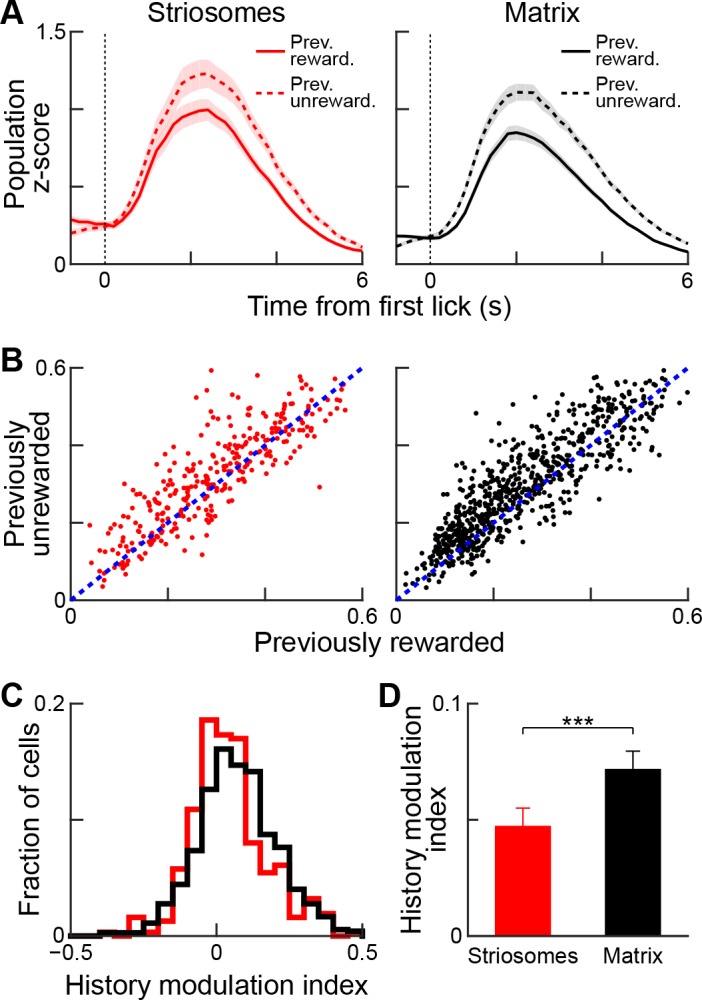
Figure 9. Reward-history modulation of striosomal and matrix neurons.

(A) Population-averaged responses of all task-modulated striosomal (red, left) and matrix (black, right) neurons during trials following previously rewarded (solid) or unrewarded (dotted) trials. Shading represents SEM. (B) Normalized lick-period responses (averaged over 1–3 s after first lick) of individual striosomal (left) and matrix (right) neurons. Responses with previously rewarded trials (x-axis) are plotted against responses from previously unrewarded trials (y-axis). Unity line is shown as blue dotted line (C) Histogram showing reward-history modulation index for all task-modulated striosomal and matrix neurons. (D) Mean reward-history modulation index for striosomal and matrix neurons. ***p<0.001 (Wilcoxon rank-sum test). Error bars represent SEM.
