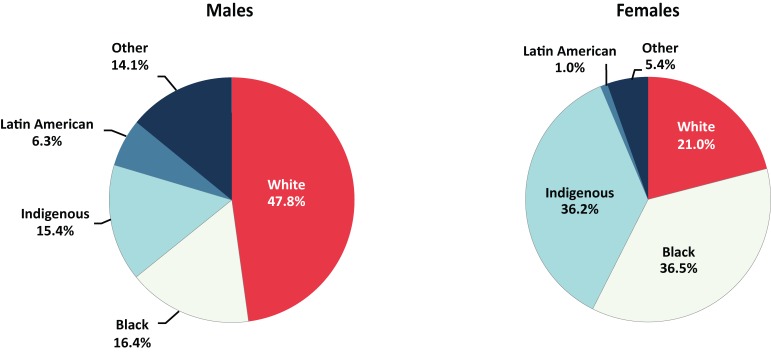
Figure 7. Proportion of reported HIV cases (all ages) by sex and race/ethnicity—Canada, 2016 1,2,3,4.
1 Race/ethnicity information is not available for Quebec and British Columbia
2 Denominators used to calculate percentages exclude HIV cases where race/ethnicity was "not reported" and HIV cases where sex was "not reported" or “reported” as transsexual or transgender
3 Latin American includes, for example, Mexican, Central American and South American
4 Other includes, for example, Pakistani, Sri Lankan, Bangladeshi, Armenian, Egyptian, Iranian, Lebanese, Moroccan, Chinese, Japanese, Vietnamese, Cambodian, Indonesian, Laotian, Korean, Filipino, Somali, Haitian and Jamaican

