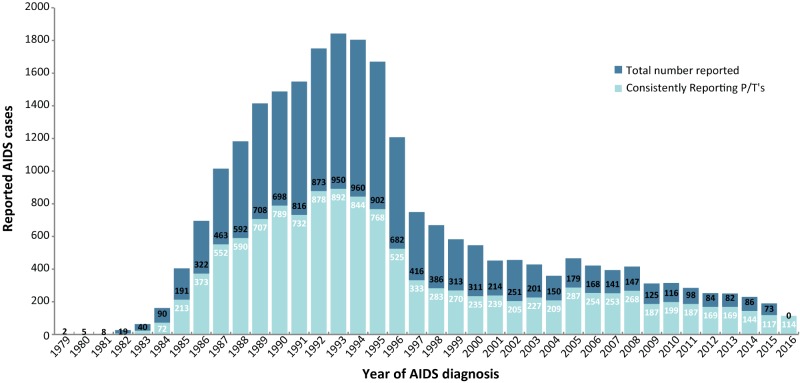
Figure 1. Number of reported AIDS cases by year of diagnosis—Canada, 1979–2016.
Abbreviation: P/T, province or territory
Legend: The upper section of the figure represents the cases reported by any P/T that has stopped reporting AIDS over time, or did not report in 2016 (QC (2003), NL (2009), PE (2012), and BC (2016). The lower portion of each bar represents the cases reported by provinces that have consistently reported AIDS cases to PHAC since 1979

