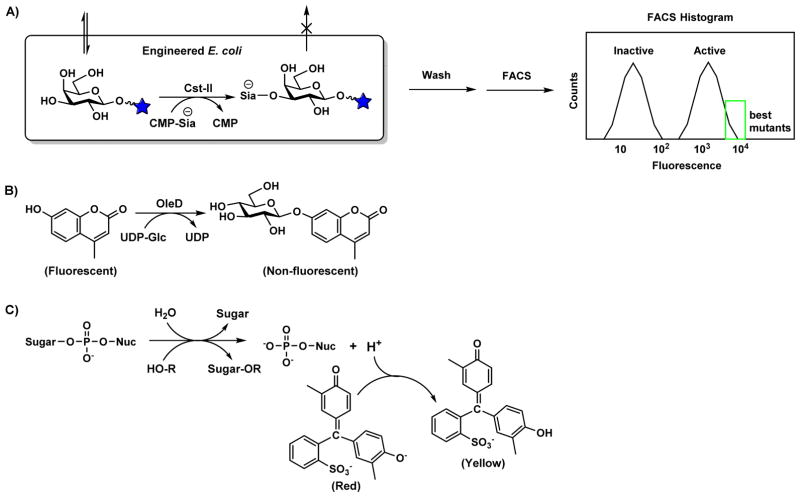
Figure 6. Molecular basis for glycosyltransferase mutant screening.
(A) In vivo sialylation of a fluorescently labeled acceptor substrate results in a cell-entrapped fluorescent product. After washing, cells which retain a high fluorescent signal can be isolated by FACS. (B) OleD-catalyzed glucosylation quenches MU fluorescence. (C) Glycosylation releases a proton, causing a pH change that can be detected using Cresol Red, a pH indicator useful across a pH range of 7.2–8.8. Donor hydrolysis, where water acts as the GT acceptor substrate, also results in the release of a proton.

