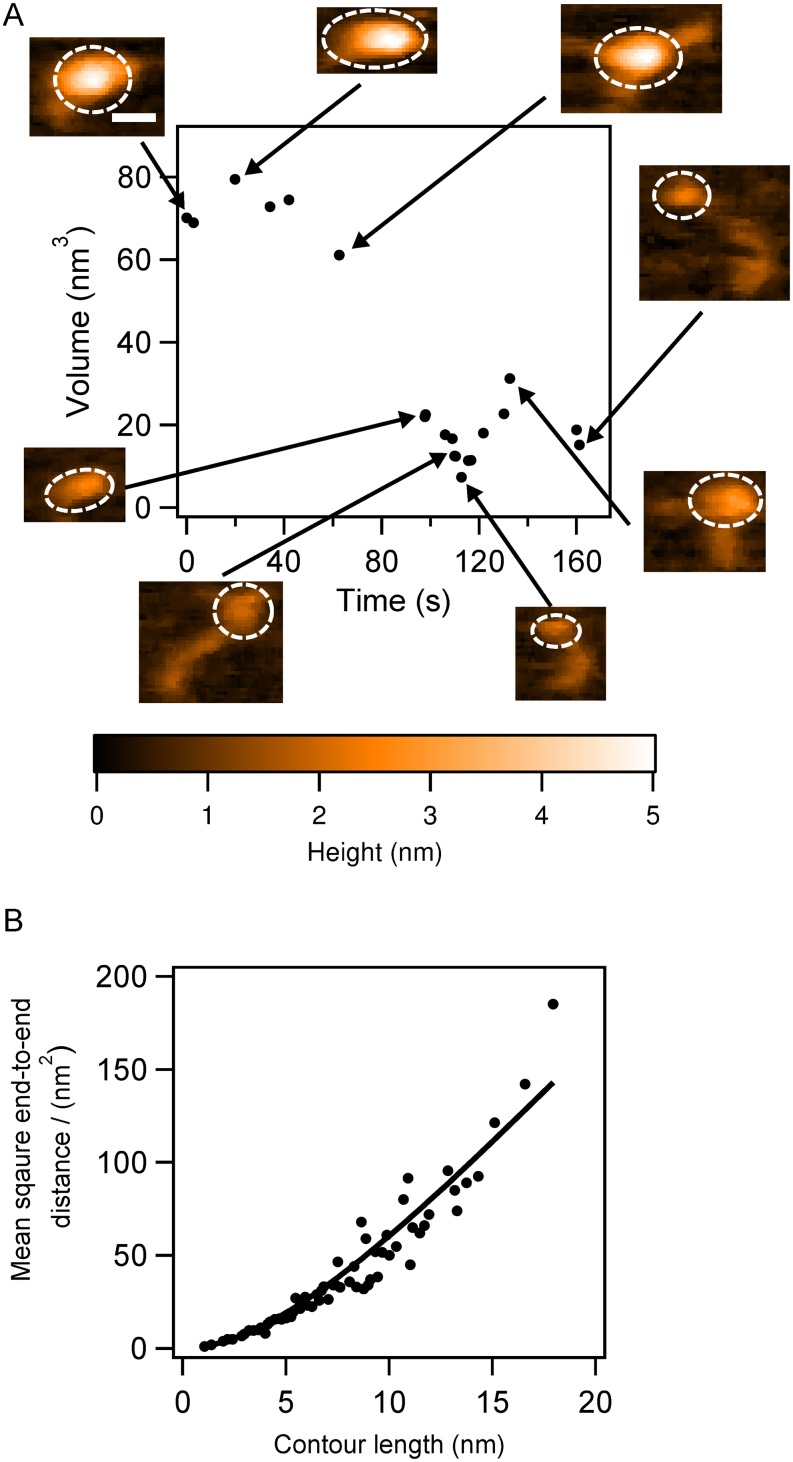
FIG. 2.
The analysis of the α-syn monomer undergoing structural transition. (a) The monomer volume (black dots) with corresponding frames at specific time points, presented as an inset in the figure, with dashed circles indicating the segments used for volume analysis. (b) The stiffness of the tail-like protrusions in the α-syn monomers. The black dots are raw data and the solid line is the fitted curve; the persistence length is 2.9 nm. The scale bar is 5 nm.

